
Reason to trust
How Our News is Made
Strict editorial policy that focuses on accuracy, relevance, and impartiality
Ad discliamer
Morbi pretium leo et nisl aliquam mollis. Quisque arcu lorem, ultricies quis pellentesque nec, ullamcorper eu odio.
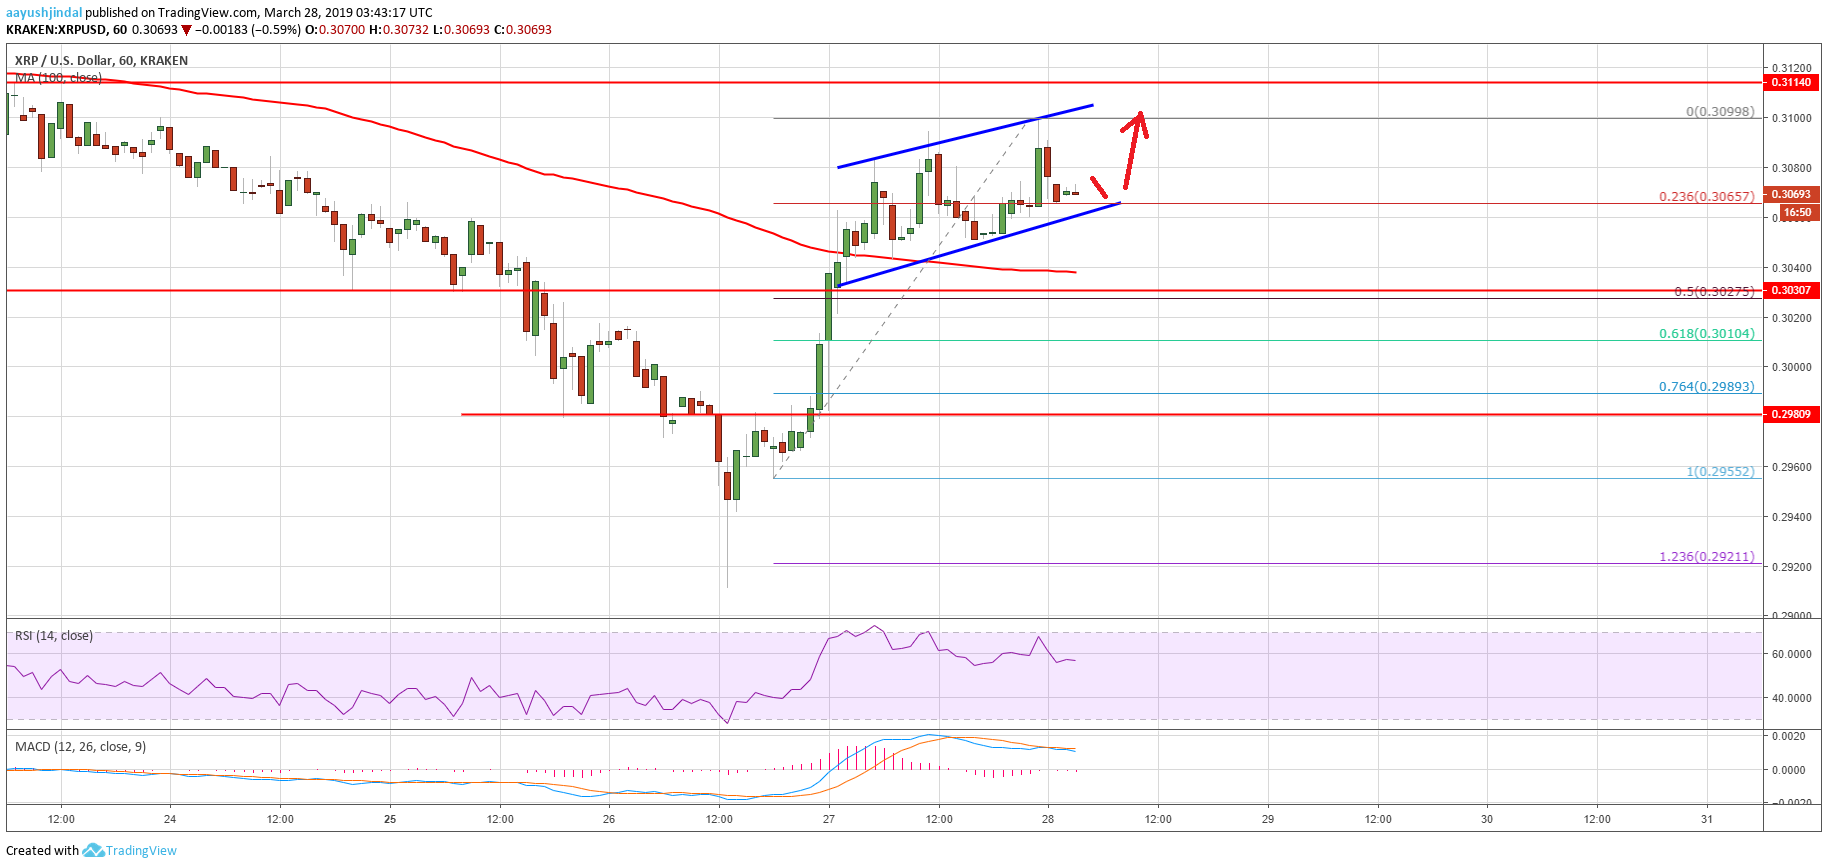
- Ripple price gained traction and settled above the $0.3030 pivot level against the US dollar.
- The price traded close to the $0.3100 resistance level and it is currently consolidating.
- There is a short term ascending channel formed with support at $0.3064 on the hourly chart of the XRP/USD pair (data source from Kraken).
- The pair is likely to trade in a range above the $0.3030 and $0.3050 supports before a fresh increase.
Ripple price moved into a positive zone with bullish moves against the US Dollar and bitcoin. XRP/USD might face a strong resistance near the $0.3100 and $0.3110 levels in the short term.
Ripple Price Analysis
After a major decline towards the $0.2920 support, ripple price found a strong buying interest against the US Dollar. The XRP/USD pair started a solid upward move and broke the $0.2980 and $0.3000 resistance levels. There was even a close above the $0.3000 barrier and the 100 hourly simple moving average. Later, buyers gained traction and pushed the price above the $0.3065 and $0.3080 resistance levels. The price traded close to the $0.3100 resistance level and formed a high at $0.3099.
At the moment, the price is consolidating gains above the $0.3065 support level. The 23.6% Fib retracement level of the last wave from the $0.2955 swing low to $0.3099 high is also near $0.3065. There is also a short term ascending channel formed with support at $0.3064 on the hourly chart of the XRP/USD pair. If there is a downside break below the channel support, the price may test the next key support near the $0.3030 level.
The 50% Fib retracement level of the last wave from the $0.2955 swing low to $0.3099 high is also near the $0.3030 level. Besides, the 100 hourly simple moving average is also positioned near the $0.3030 support area. Overall, the price is trading nicely above the $0.3065 and $0.3030 support levels. In the short term, there could be range moves above the $0.3065 and $0.3030 supports before buyer’s stage for a fresh increase.
Looking at the chart, ripple price is clearly trading nicely with a bullish bias above $0.3030. On the upside, the main resistance is near the $0.3100 level. Above this, the price is likely to face a strong selling interest near the $0.3115 level. A proper close above the $0.3115 barrier is likely to open the doors for more gains towards the $0.3200 level.
Technical Indicators
Hourly MACD – The MACD for XRP/USD is about to move back in the bullish zone.
Hourly RSI (Relative Strength Index) – The RSI for XRP/USD is currently well above the 50 level, with a positive bias.
Major Support Levels – $0.3065, $0.3030 and $0.3010.
Major Resistance Levels – $0.3095, $0.3100 and $0.3115.


