
Reason to trust
How Our News is Made
Strict editorial policy that focuses on accuracy, relevance, and impartiality
Ad discliamer
Morbi pretium leo et nisl aliquam mollis. Quisque arcu lorem, ultricies quis pellentesque nec, ullamcorper eu odio.
- ETH price failed to climb above the $137 resistance and declined later against the US Dollar.
- The price declined heavily and broke the $134 and $132 support levels.
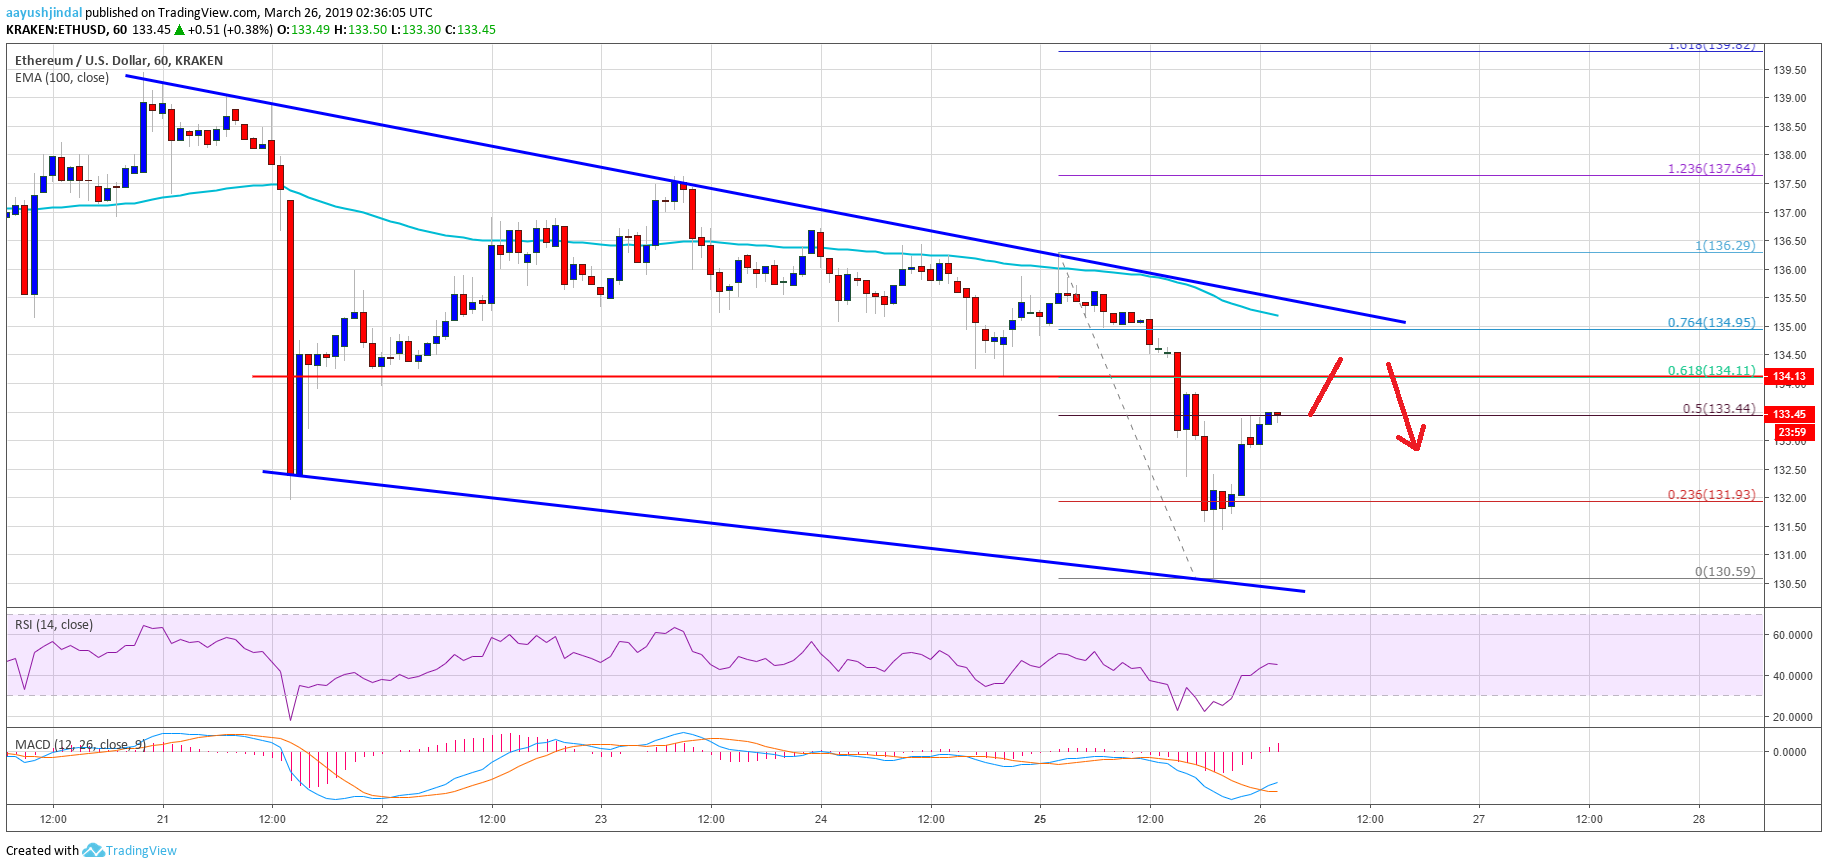
- Yesterday’s highlighted key bearish trend line is active with resistance at $135 on the hourly chart of ETH/USD (data feed via Kraken).
- The pair is currently correcting higher, but it is likely to face sellers near $134 and $135.
Ethereum price declined sharply below key supports against the US Dollar and bitcoin. ETH might correct higher, but it is likely to struggle near the $135 resistance area in the near term.
Ethereum Price Analysis
Yesterday, we discussed the importance of the $136-137 resistance and the 100 hourly simple moving average against the US Dollar. The ETH/USD pair made an attempt to climb above the $136 resistance, but it failed to gain momentum. As a result, there was a sharp bearish reaction below the $135 support level. The decline was such that the price even broke the $134 and $132 support levels. It traded to a new weekly low near $130 and later started an upside correction.
Buyers pushed the price above the $132 level and the 23.6% Fib retracement level of the recent decline from the $136 high to $130 low. However, there are many hurdles on the upside near the $134 and $135 levels. The first hurdle is near $134 and the 61.8% Fib retracement level of the recent decline from the $136 high to $130 low. The stated $134 level was a support earlier, and now it may act as a resistance. Besides, yesterday’s highlighted key bearish trend line is active with resistance at $135 on the hourly chart of ETH/USD.
Lastly, the 100 hourly SMA is also near the $135 level and the trend line. Therefore, if the price continues to rise it is likely to face sellers near the $134 or $135 resistance. On the downside, an initial support is at $132, below which the price may revisit the $130 swing low. Any further losses could lead the price towards the $125 support.
Looking at the chart, ETH price is facing a lot of hurdles near $134 and $135. Therefore, buying near the stated resistance and 100 SMA might not be a good idea. Clearly, sellers remain in action near $135 and there are chances of a fresh dip towards $132 or $130 in the coming sessions.
ETH Technical Indicators
Hourly MACD – The MACD for ETH/USD moved into the bullish zone, with a positive bias.
Hourly RSI – The RSI for ETH/USD recovered nicely above 40, but it is still well below the 50 level.
Major Support Level – $130
Major Resistance Level – $135


