
Reason to trust
How Our News is Made
Strict editorial policy that focuses on accuracy, relevance, and impartiality
Ad discliamer
Morbi pretium leo et nisl aliquam mollis. Quisque arcu lorem, ultricies quis pellentesque nec, ullamcorper eu odio.
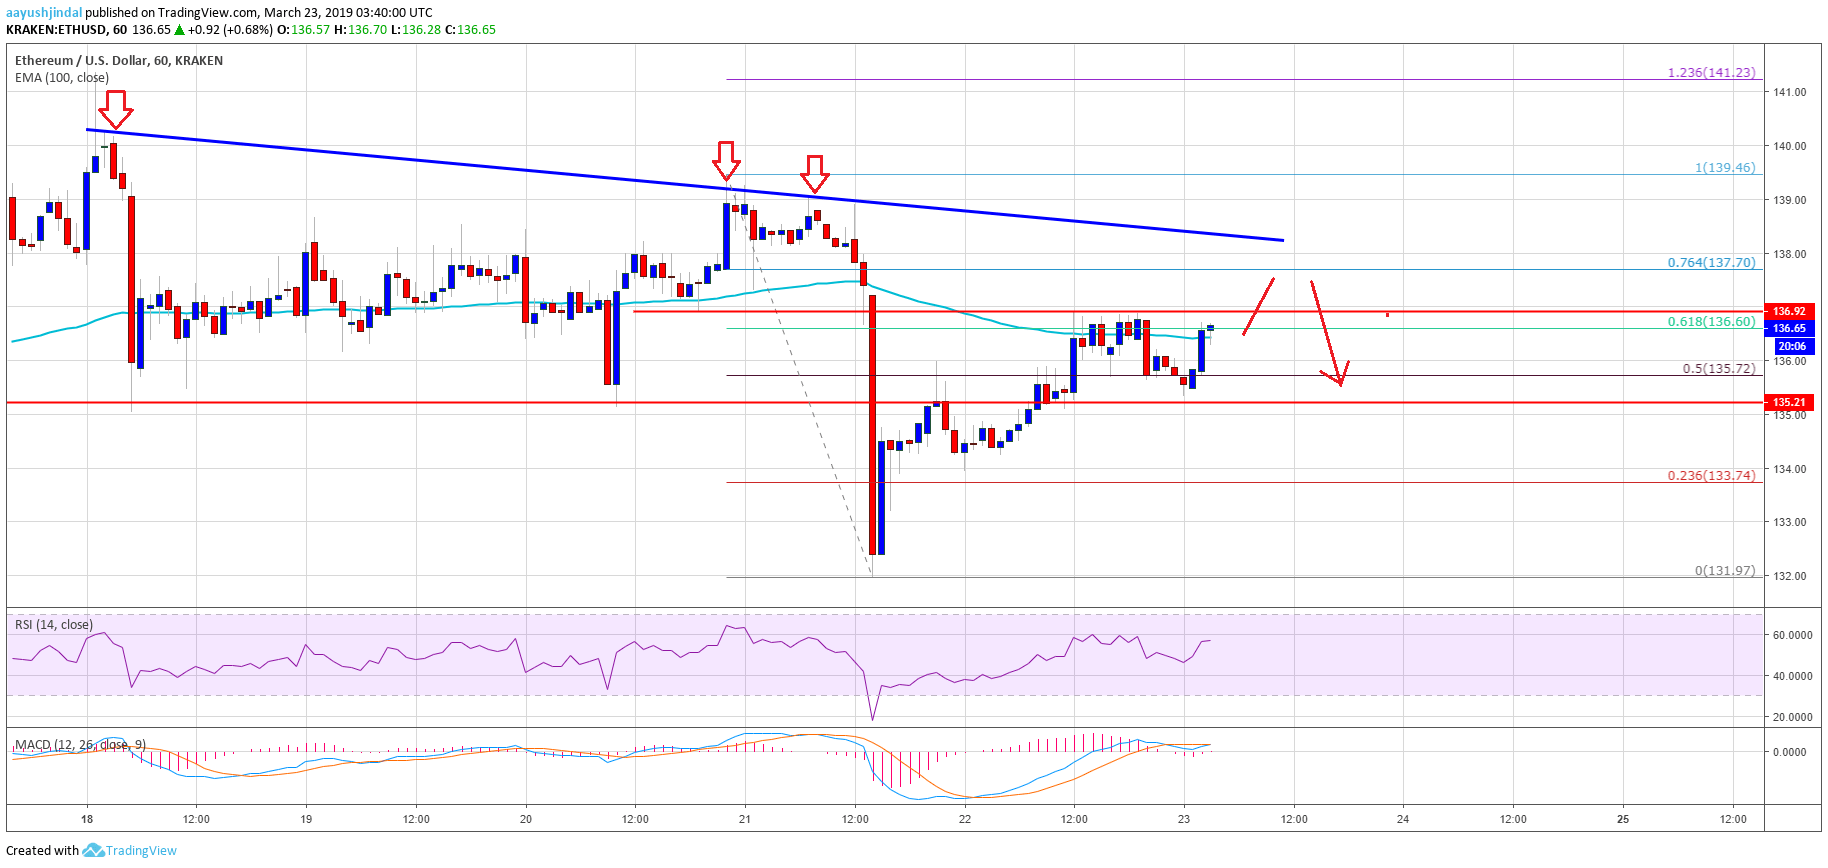
- ETH price recovered nicely from the $132 support level and traded above $134 against the US Dollar.
- The price even cleared the $135 and $136 resistance levels, but upsides remain capped.
- There is a crucial bearish trend line formed with resistance at $138 on the hourly chart of ETH/USD (data feed via Kraken).
- The pair might face a strong resistance near the $138 level and it could drop back to $135.
Ethereum price is slowly recovering higher against the US Dollar and bitcoin. However, there are many hurdles for ETH buyers near the $138 and $139 levels.
Ethereum Price Analysis
Recently, we saw a major drop in ETH price below the $134 support level against the US Dollar. The ETH/USD pair traded close to the $132 support level and later started a decent recovery. It climbed back above the $134 and $135 resistance levels. There was also a close above the $135 level and the 50% Fib retracement level of the recent decline from the $140 swing high to $132 low. However, there are still many hurdled for buyers on the upside, starting with $137 and ending near $140.
The price is currently trading near the $137 resistance and the 100 hourly simple moving average. Besides, the 61.8% Fib retracement level of the recent decline from the $140 swing high to $132 low is also near the $137 level. On the upside, there is a strong resistance formed near the $138 level. There is also a crucial bearish trend line formed with resistance at $138 on the hourly chart of ETH/USD.
Below the trend line, the 76.4% Fib retracement level of the recent decline from the $140 swing high to $132 low is positioned. Therefore, if the price continues to move higher, it could face sellers near the $137 and $138 levels. The next main resistance is near the $140 level, which prevented gains on many occasions recently. On the downside, an initial support is at $135. A break below the $135 level may push the price back towards the $132 level.
Looking at the chart, ETH price is slowly climbing high and moving back in the key $130-140 range. It may continue to rise towards the range resistance, but a break above $138 and $140 won’t be easy. There are even chances of a fresh drop below $135 before the price climbs higher towards $140.
ETH Technical Indicators
Hourly MACD – The MACD for ETH/USD is showing positive signs and it could move into the bullish zone.
Hourly RSI – The RSI for ETH/USD is now well above the 50 level and it is moving higher towards the 60 level.
Major Support Level – $135
Major Resistance Level – $137


