
Reason to trust
How Our News is Made
Strict editorial policy that focuses on accuracy, relevance, and impartiality
Ad discliamer
Morbi pretium leo et nisl aliquam mollis. Quisque arcu lorem, ultricies quis pellentesque nec, ullamcorper eu odio.
- ETH price failed to break the $139 resistance and declined sharply against the US Dollar.
- The price broke the key $134 support level to enter a bearish zone.
- A new connecting bearish trend line is formed with resistance at $139 on the hourly chart of ETH/USD (data feed via Kraken).
- The pair is likely to struggle near the $135 and $136 levels if it corrects higher in the near term.
Ethereum price declined sharply below key supports against the US Dollar and bitcoin. ETH settled below $136 and the 100 hourly SMA, which is a short-term bearish sign.
Ethereum Price Analysis
There was another attempt by ETH price to climb above the $139-140 resistance area against the US Dollar. The ETH/USD pair failed to surpass the $140 resistance and later started a downside move. There were range moves above $138 before sellers took charge and pushed the price below $136 and the 100 hourly simple moving average. There was a break below a connecting bullish trend line at $138 on the hourly chart, opening the doors for more losses.
As a result, there was a sharp decline and the price tumbled below the $134 support level. The price traded towards the $132 support and settled below the 100 hourly simple moving average. Recently, it corrected higher above the $133 level and the 23.6% Fib retracement level of the last drop from the $140 swing high to $132 low. Buyers even pushed the price above the $134 level, but upsides were capped by the $136 resistance. Besides, the 50% Fib retracement level of the last drop from the $140 swing high to $132 low acted as a resistance.
It seems like the previous support area near $136 is acting as a solid resistance. Therefore, the price may consolidate in the short term before it makes another attempt to clear the $136 level. On the upside, the next resistance is near $137 and the 100 hourly SMA. Moreover, there is a new connecting bearish trend line is forming with resistance at $139 on the hourly chart of ETH/USD.
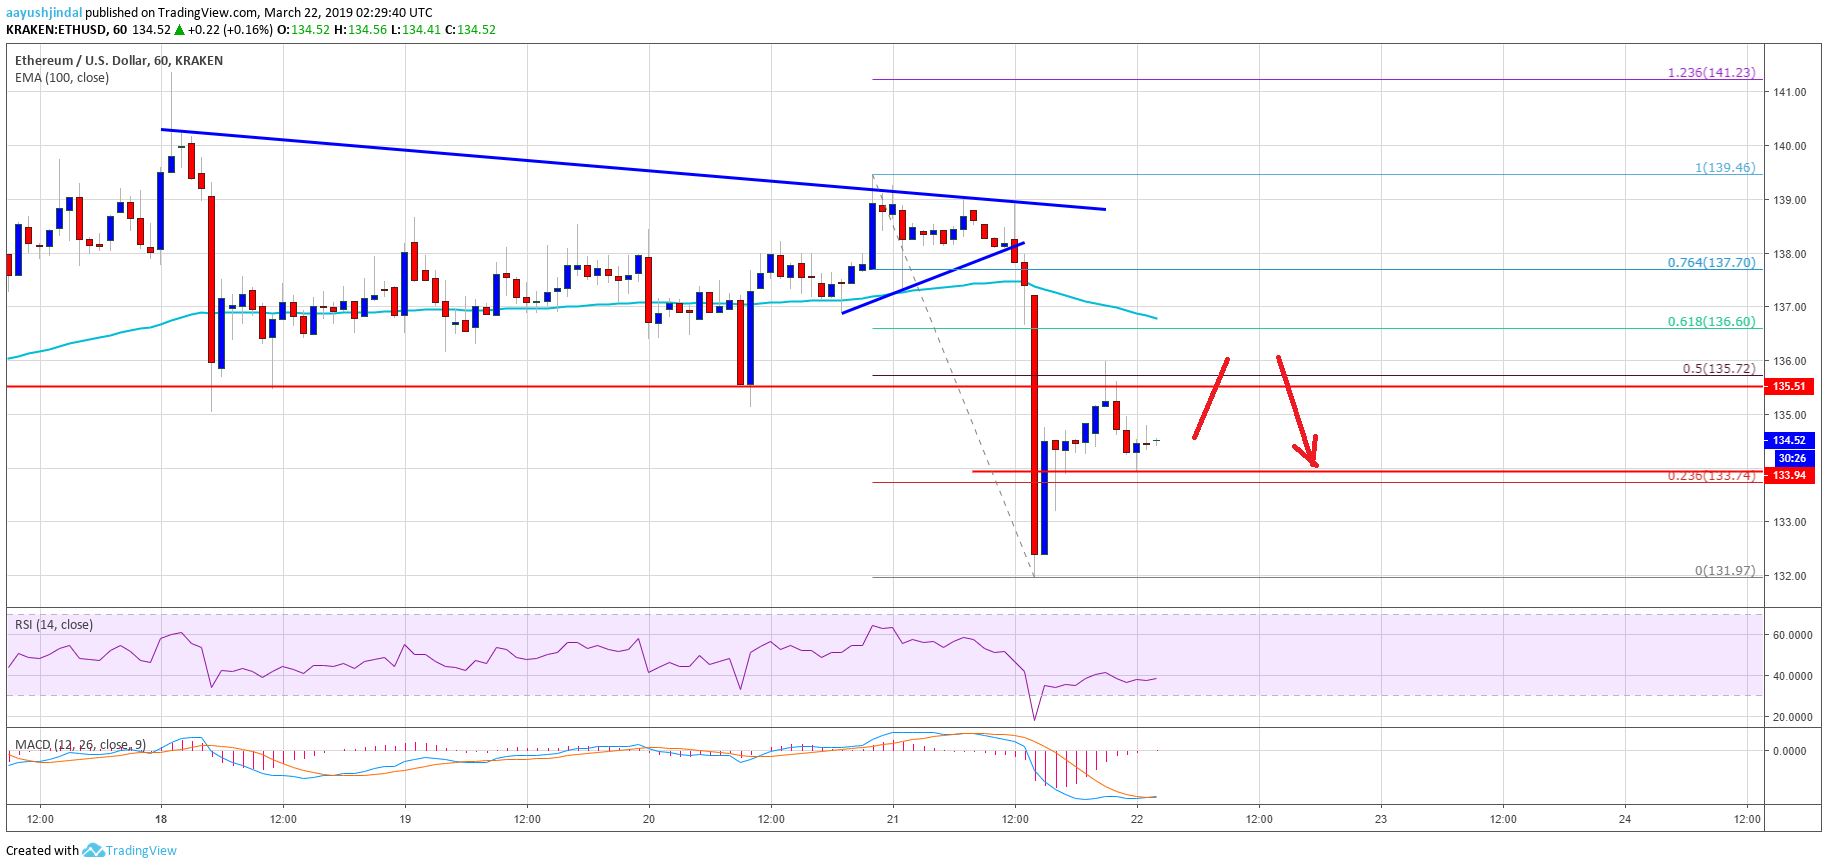
Looking at the chart, ETH price clearly moved into a bearish zone below the $136 support and the 100 hourly SMA. If buyers struggle to push the price back above the $136 and $137 levels, there is a risk of more downsides. An initial support is near $134, below which the price may revisit the $132 swing low.
ETH Technical Indicators
Hourly MACD – The MACD for ETH/USD is about to move into the bullish zone.
Hourly RSI – The RSI for ETH/USD declined below the 50 level and it is currently below the 40 level.
Major Support Level – $132
Major Resistance Level – $137


