
Reason to trust
How Our News is Made
Strict editorial policy that focuses on accuracy, relevance, and impartiality
Ad discliamer
Morbi pretium leo et nisl aliquam mollis. Quisque arcu lorem, ultricies quis pellentesque nec, ullamcorper eu odio.
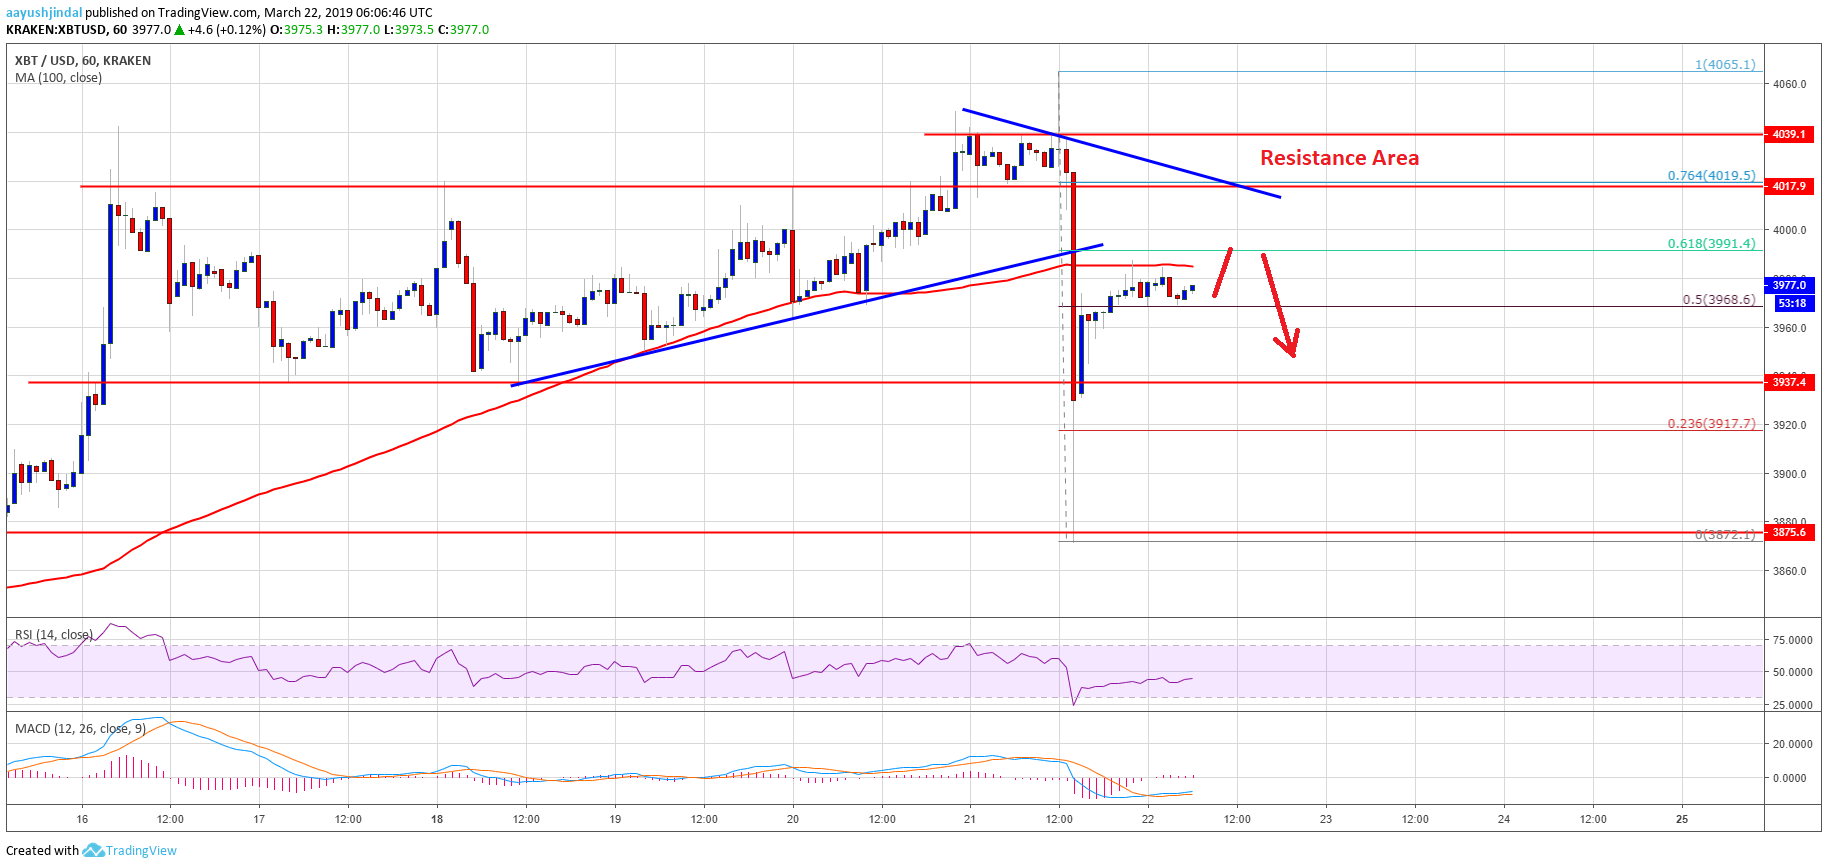
- Bitcoin price traded to a new weekly high above $4,060 and later declined sharply against the US Dollar.
- The price broke the key $3,960 support level and tested the next main support at $3,875.
- There is a short-term connecting bearish trend line formed with resistance near $4,015 on the hourly chart of the BTC/USD pair (data feed from Kraken).
- The recent rebound was positive, but it won’t be easy for buyers to reclaim $4,000 and $4,020.
Bitcoin price rebounded sharply after a massive drop below $3,900 against the US Dollar. BTC must climb above $4,000 to move back in a positive zone and revisit $4,060.
Bitcoin Price Analysis
Yesterday, there was an upside extension in bitcoin price above the $4,020 resistance against the US Dollar. The BTC/USD pair broke the $4,050 resistance and traded to a new monthly high at $4,065. However, buyers failed to stay in control, resulting in a sharp decline below $4,050 and $4,020. The price even broke the $4,000 support and settled below the 100 hourly simple moving average. The decline was strong as the price even failed to hold the $3,950 and $3,900 support levels.
However, the next key support at $3,875 prevented further declines. A swing low was formed at $3,872 and later the price bounced back sharply. It broke the $3,900 resistance and the 23.6% Fib retracement level of the recent decline from the $4,065 high to $3,872 low. More importantly, the price rebounded above the $3,950 resistance level. Finally, there was a close above the 50% Fib retracement level of the recent decline from the $4,065 high to $3,872 low.
At the moment, the price is facing a strong resistance near $3,990 and the 100 hourly simple moving average. The main resistance is near $4,000 and the 61.8% Fib retracement level of the recent decline from the $4,065 high to $3,872 low. Besides, there is a short-term connecting bearish trend line formed with resistance near $4,015 on the hourly chart of the BTC/USD pair. Therefore, a break above the $4,000 and $4,020 resistance levels is must for additional gains in the coming sessions.
Looking at the chart, bitcoin price rebounded nicely from the $3,875 support level. However, buyers might find it difficult to gain strength above $4,000 and $4,020. If they continue to face hurdles, there could be another bearish reaction below the $3,950 and $3,920 support levels.
Technical indicators:
Hourly MACD – The MACD is slowly moving in the bullish zone, with a positive bias.
Hourly RSI (Relative Strength Index) – The RSI for BTC/USD is currently correcting higher, but it is still well below the 50 level.
Major Support Levels – $3,950 followed by $3,920.
Major Resistance Levels – $4,000, $4,020 and $4,060.


