
Reason to trust
How Our News is Made
Strict editorial policy that focuses on accuracy, relevance, and impartiality
Ad discliamer
Morbi pretium leo et nisl aliquam mollis. Quisque arcu lorem, ultricies quis pellentesque nec, ullamcorper eu odio.
- ETH price continues to face a strong resistance near the $138 and $140 levels against the US Dollar.
- The price failed to gain strength above the $139 level and remained below the $140 pivot.
- Yesterday’s key bearish trend line is intact with resistance near $138 on the hourly chart of ETH/USD (data feed via Kraken).
- The pair remains at a risk of a sharp decline towards the $133 support before it could bounce back.
Ethereum price is trading below important resistances against the US Dollar and bitcoin. ETH must break the $138 and $140 resistance to avoid a sharp downside reaction in the near term.
Ethereum Price Analysis
Recently, we saw a downside correction in ETH price below the $140 and $138 supports against the US Dollar. The ETH/USD pair tested the $135 support level and later started consolidating in a range. It recovered a few points above the $136 level and the 100 hourly simple moving average. There was also a break above the 23.6% Fib retracement level of the last drop from the $141 high to $135 low. However, the price faced a strong resistance near the $138 and $139 levels.
Sellers defended the 50% Fib retracement level of the last drop from the $141 high to $135 low. More importantly, yesterday’s key bearish trend line is intact with resistance near $138 on the hourly chart of ETH/USD. Therefore, there is a strong resistance formed near $138. A proper close above the trend line could push the price towards the $141 resistance area. Once there is a follow through above the $141 swing high, the price may continue to rise towards the $144 and $145 levels.
On the other hand, if buyers fail to gain strength above the trend line and $139, there could be a sharp decline. An immediate support is near the $135 level. However, in the mentioned bearish scenario, there are chances of a fresh weekly low near the $133 or $132 support. If there are more declines, the price could head towards the key $129 support area.
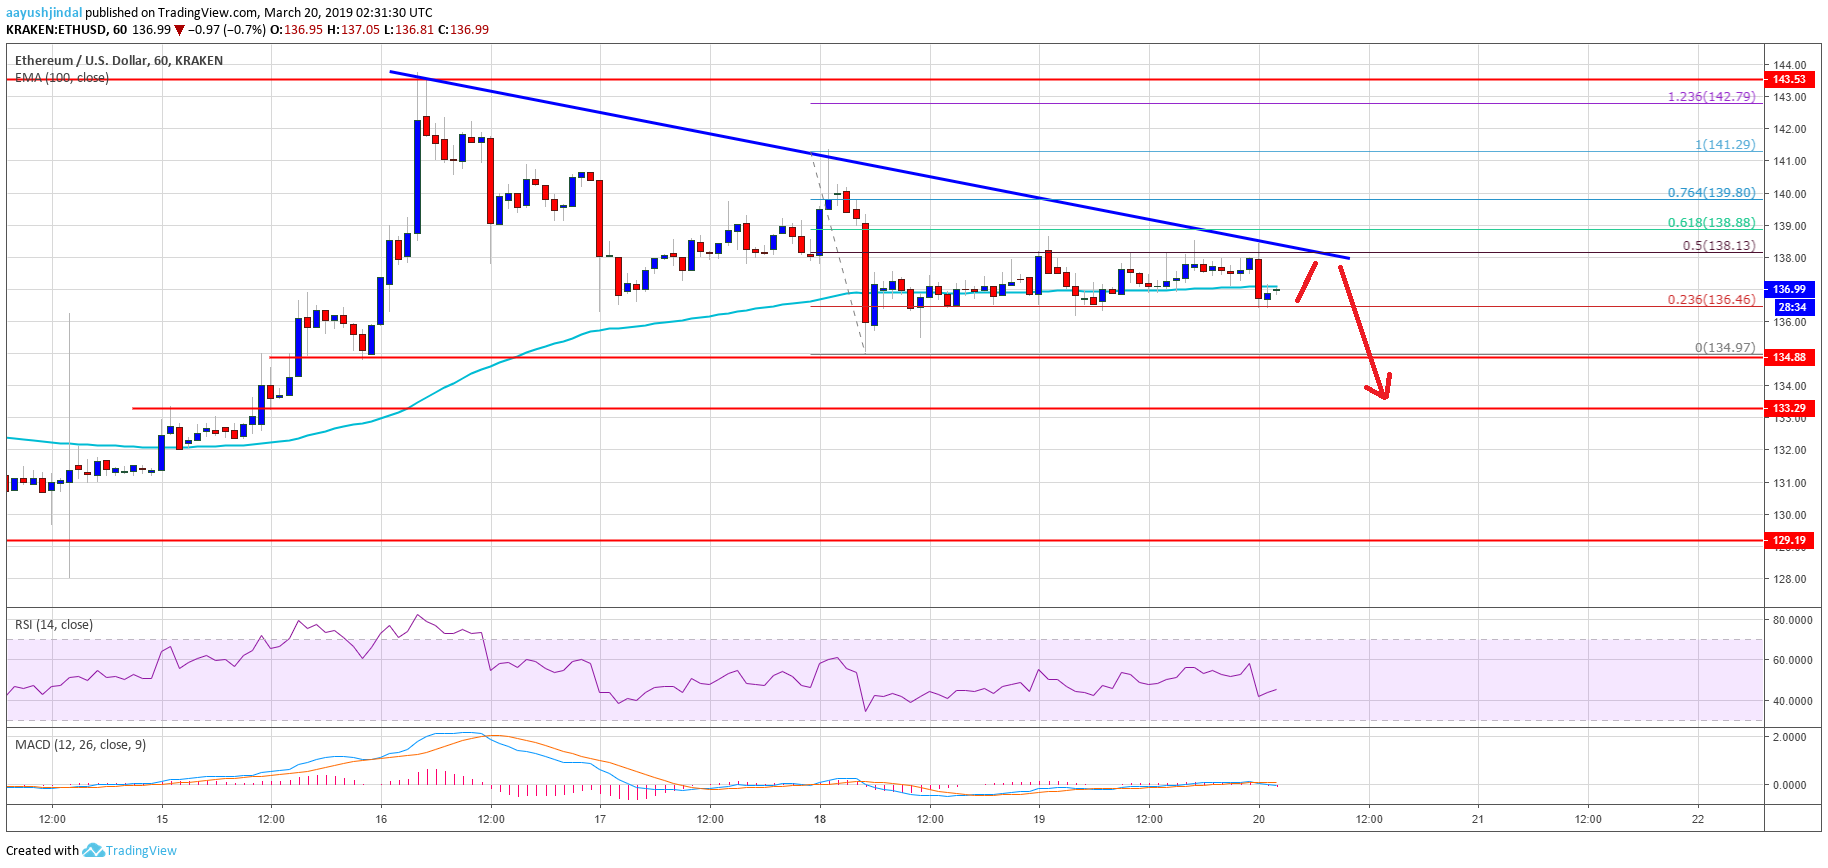
Looking at the chart, ETH price is clearly trading near a crucial juncture below $138 and $139. A continuous failure to gain bullish momentum above $138 is likely to result in a bearish reaction. Sellers are likely to take control below $135 and the price may move into a short term bearish zone. The key supports to watch are $133 and $129.
ETH Technical Indicators
Hourly MACD – The MACD for ETH/USD is currently flat in the bearish zone.
Hourly RSI – The RSI for ETH/USD recently dipped below the 50 level with a bearish angle and tested the 40 level.
Major Support Level – $135
Major Resistance Level – $138


