
Reason to trust
How Our News is Made
Strict editorial policy that focuses on accuracy, relevance, and impartiality
Ad discliamer
Morbi pretium leo et nisl aliquam mollis. Quisque arcu lorem, ultricies quis pellentesque nec, ullamcorper eu odio.
- Bitcoin price rallied recently after it broke the key $3,900 resistance area against the US Dollar.
- The price surged higher and broke the $3,950 and $4,000 hurdles to set the pace for more gains.
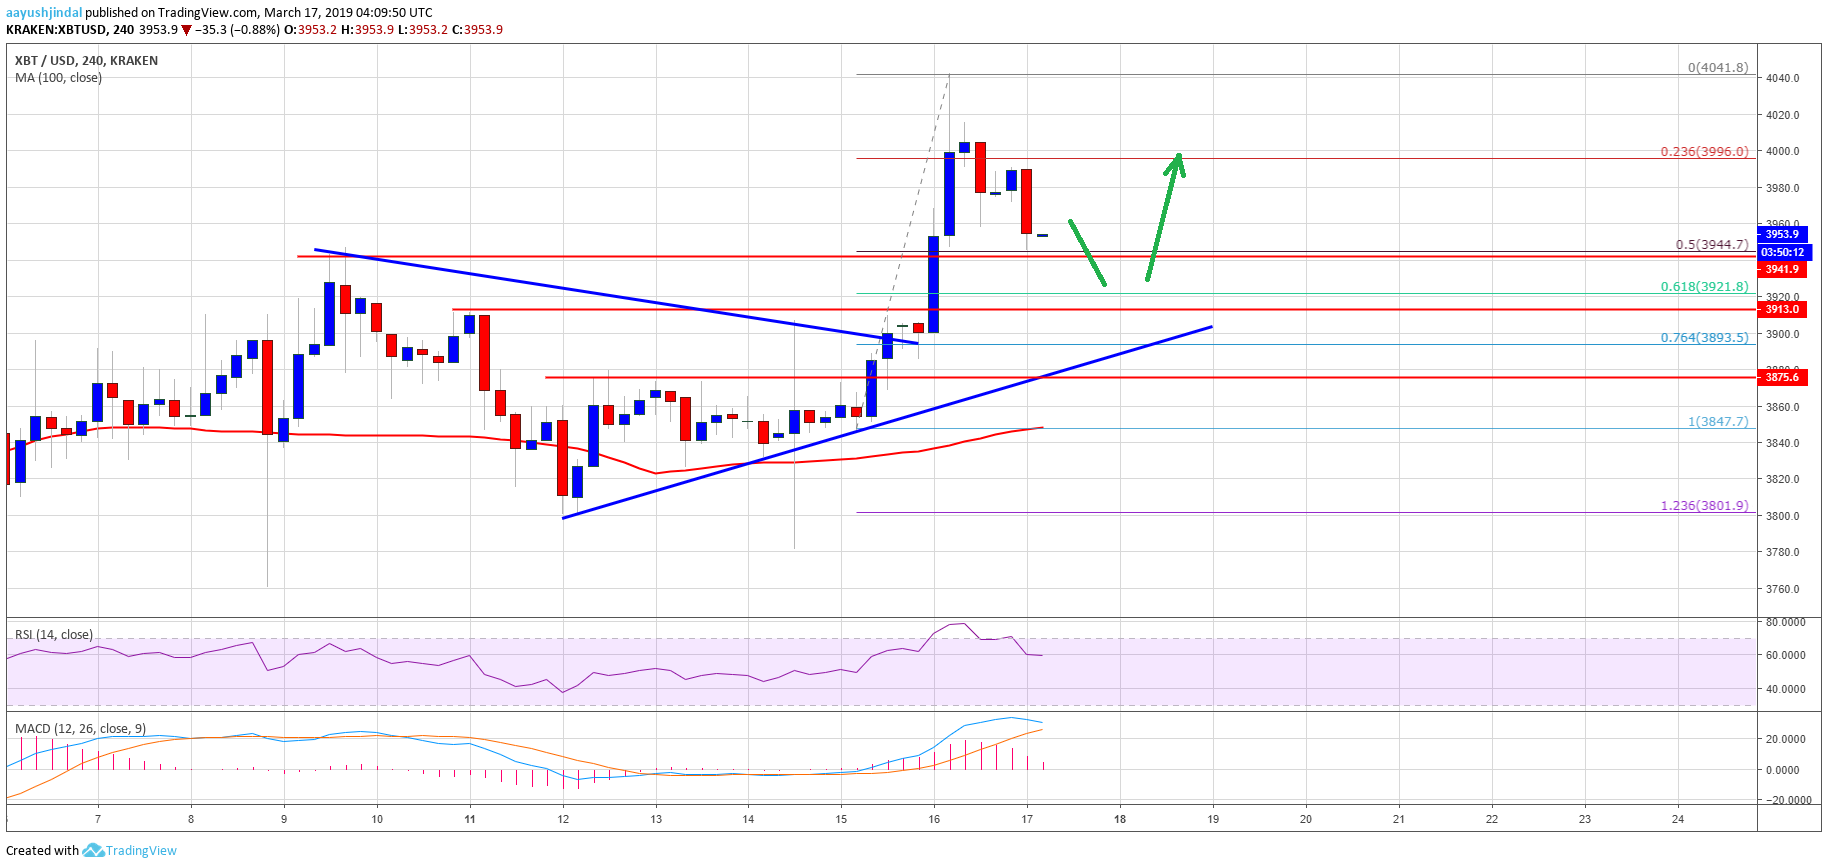
- There is a major connecting bullish trend line formed with support at $3,900 on the 4-hours chart of the BTC/USD pair (data feed from Kraken).
- The pair is currently correcting lower, but it is likely to find support near $3,920 or $3,900.
Bitcoin price climbed sharply into a bullish zone above $3,900 against the US Dollar. BTC/USD is placed nicely in an uptrend and dips close to $3,920 remain supported for a fresh bullish wave.
Bitcoin Price Analysis
This past week, there were a couple of bearish reactions below the $3,850 level in bitcoin price against the US Dollar. The BTC/USD pair spiked towards the $3,800 level on two occasions, but buyers protected additional losses. Finally, the price started a nice bullish wave and broke the $3,850 and $3,900 resistance levels. It opened the doors for more gains above $3,900 and the price settled above the 100 simple moving average (4-hours). During the upside, the price broke a key bearish trend line with resistance at $3,890 to move into a bullish zone.
Buyers gained control and the price rallied above the $4,000 level. It traded as high as $4,041 before sellers appeared. Later, a downside correction initiated below the $4,000 support. Sellers pushed the price below the 23.6% Fib retracement level of the recent wave from the $3,847 low to $4,041 high. The price declined sharply and tested the previous resistance (now support) at $3,950. Besides, the 50% Fib retracement level of the recent wave from the $3,847 low to $4,041 high is currently acting as a support.
More importantly, there is a major connecting bullish trend line formed with support at $3,900 on the 4-hours chart of the BTC/USD pair. Therefore, if the price continues to move down, it could find a strong support above the $3,900 level. On the upside, an initial resistance is at $4,000, above which the price is likely to retest the $4,040 swing high.
Looking at the chart, BTC price nicely moved into a bullish zone above $3,900. In the short term, there could be a few swing moves towards $3,920 or $3,900, but the price is likely to find a strong buying interest. Sooner or later, there are high chances of a fresh upward move above the $4,000 and $4,040 levels.
Technical indicators
4 hours MACD – The MACD for BTC/USD is slowly reducing its bullish slope.
4 hours RSI (Relative Strength Index) – The RSI for BTC/USD corrected lower and tested the 60 level.
Major Support Level – $3,900
Major Resistance Level – $4,040


