
Reason to trust
How Our News is Made
Strict editorial policy that focuses on accuracy, relevance, and impartiality
Ad discliamer
Morbi pretium leo et nisl aliquam mollis. Quisque arcu lorem, ultricies quis pellentesque nec, ullamcorper eu odio.
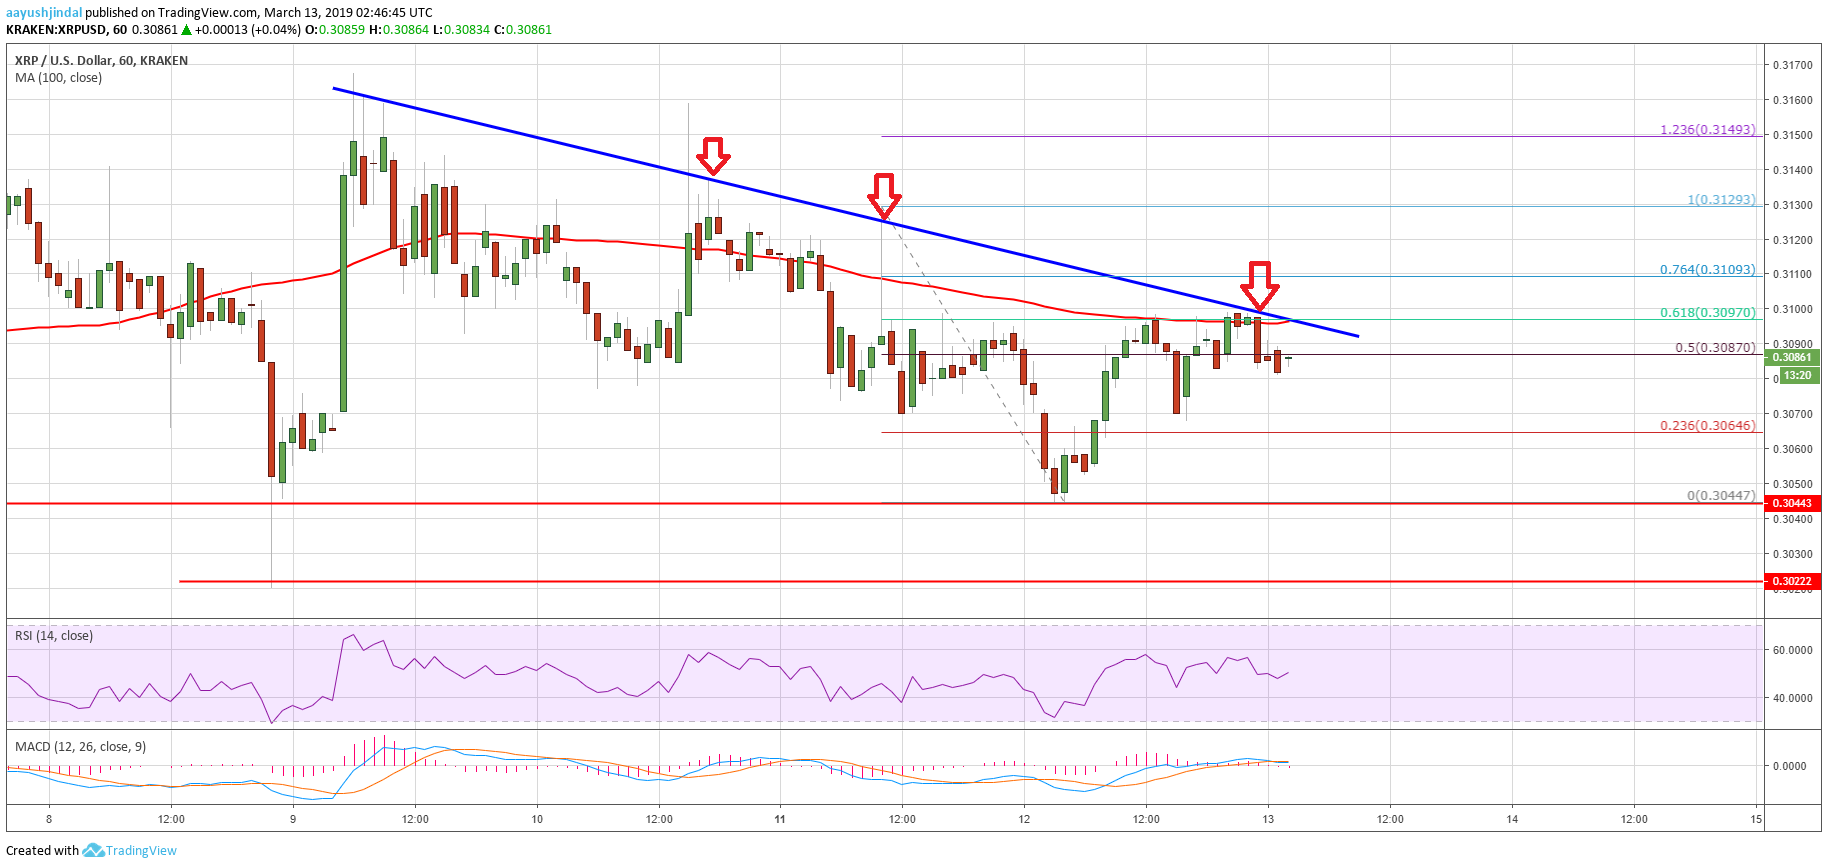
- Ripple price retested the $0.3045 support level and later corrected higher against the US dollar.
- The price recovered above $0.3060, but it struggled near the 100 hourly simple moving average.
- There is a crucial bearish trend line in place with resistance at $0.3100 on the hourly chart of the XRP/USD pair (data source from Kraken).
- The pair must settle above $0.3100 and the 100 hourly SMA to gain bullish momentum.
Ripple price faced many hurdles recently against the US Dollar and bitcoin. XRP/USD is currently struggling near the $0.3100 resistance and likely preparing for the next move.
Ripple Price Analysis
There was a slow and steady decline in ripple price below the $0.3120 resistance against the US Dollar. The XRP/USD pair extended declines recently and revisited the $0.3045 support level. Buyers protected the $0.3045 area once again and the price started an upside correction. A low was formed at $0.3044 and the price moved above the $0.3060 and $0.3065 resistance levels. The price even broke the $0.3080 level and the 50% Fib retracement level of the recent drop from the $0.3129 high to $0.3044 low.
However, the upside move was capped by the $0.3100 resistance and the 100 hourly simple moving average. Besides, the 61.8% Fib retracement level of the recent drop from the $0.3129 high to $0.3044 low acted as a resistance. More importantly, there is a crucial bearish trend line in place with resistance at $0.3100 on the hourly chart of the XRP/USD pair. It seems like there is a strong resistance formed near $0.3100 and the 100 hourly SMA.
Therefore, buyers need to gain strength above $0.3100 to start a decent rebound. The next resistance is at $0.3125 or the $0.3129 swing high. Above these, the price could test $0.3150 and the 1.236 Fib extension level of the recent drop from the $0.3129 high to $0.3044 low. On the other hand, if the price fails to move past the $0.3100 resistance, there could be a fresh decline. An initial support is near the $0.3065 level, below which the price may slide to $0.3045.
Looking at the chart, ripple price is trading near make-or-break zone near $0.3100. If buyers fail to gain strength above $0.3100 and the 100 hourly SMA, the price could decline once again. The main support is near the $0.3045 level, below which there is a risk of a drop to $0.3015.
Technical Indicators
Hourly MACD – The MACD for XRP/USD is about to move into the bearish zone, with a negative bias.
Hourly RSI (Relative Strength Index) – The RSI for XRP/USD is currently near the 50 level, with a positive angle.
Major Support Levels – $0.3065, $0.3045 and $0.3015.
Major Resistance Levels – $0.3095, $0.3100 and $0.3125.


