
Reason to trust
How Our News is Made
Strict editorial policy that focuses on accuracy, relevance, and impartiality
Ad discliamer
Morbi pretium leo et nisl aliquam mollis. Quisque arcu lorem, ultricies quis pellentesque nec, ullamcorper eu odio.
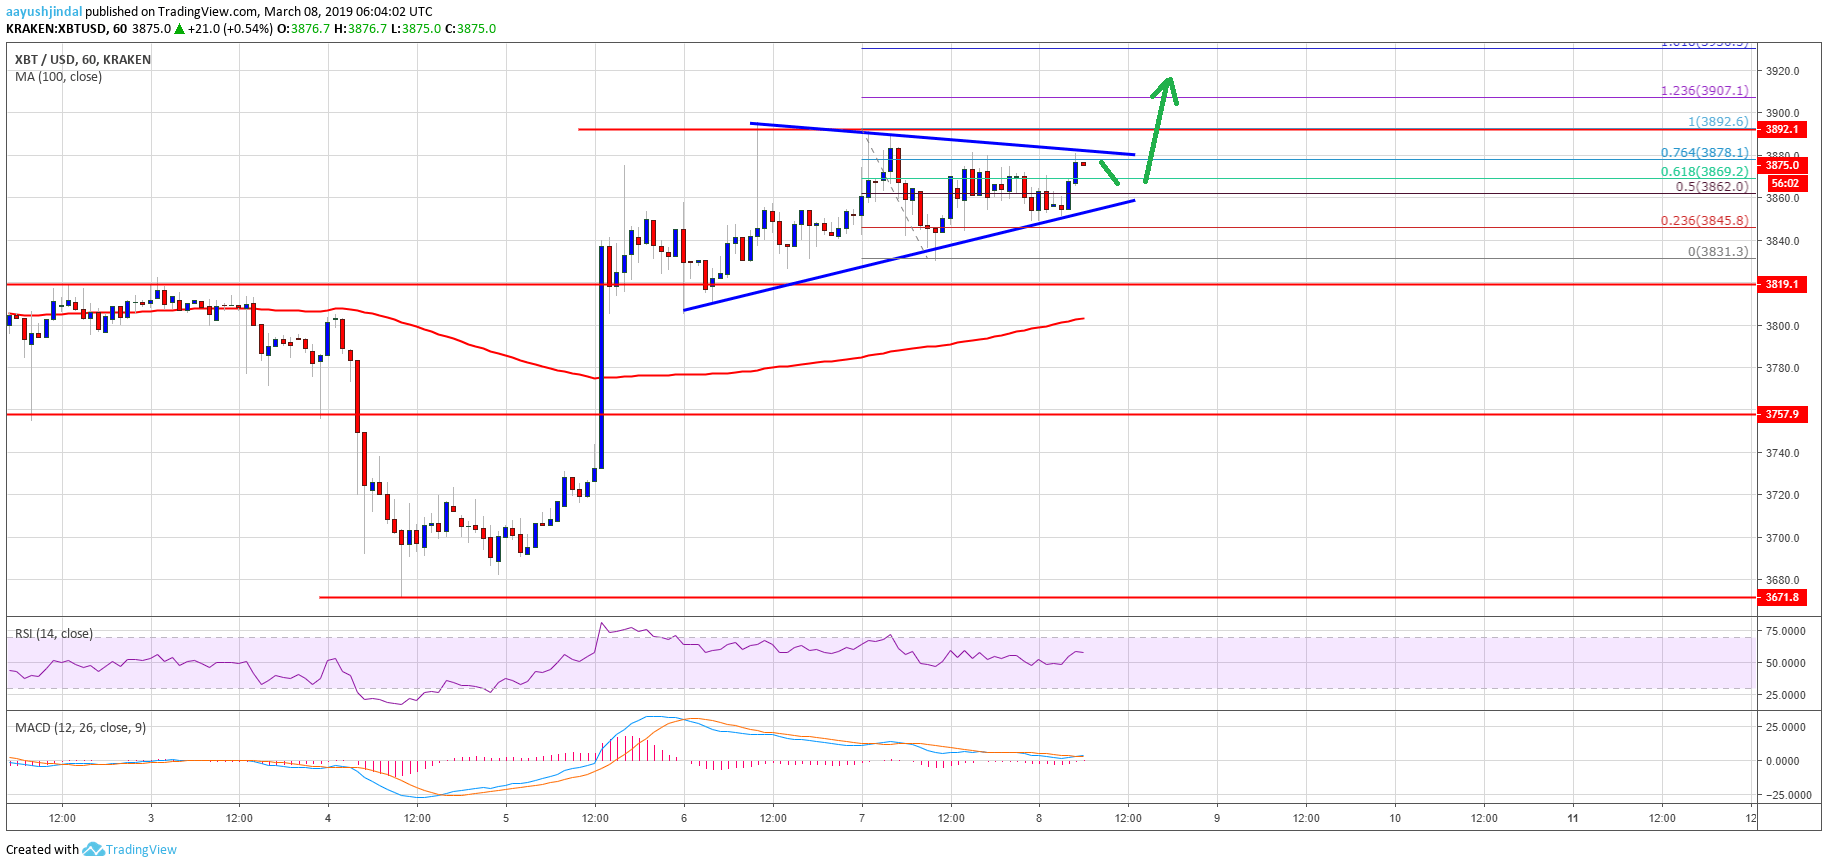
- Bitcoin price is currently consolidating above the $3,820 and $3,840 supports against the US Dollar.
- The price placed in a positive zone, with a bullish angle towards the $4,000 resistance.
- There is a symmetrical triangle pattern formed with resistance at $3,880 on the hourly chart of the BTC/USD pair (data feed from Kraken).
- The pair will most likely break the $3,880 and $3,900 resistance levels to climb above or challenge $4,000.
Bitcoin price is forming a bullish breakout pattern above the $3,800 support against the US Dollar. BTC could surge above the $3,900 and $4,000 resistance levels in the near term.
Bitcoin Price Analysis
After a strong upward move above the $3,850 level, bitcoin price started consolidating gains against the US Dollar. The BTC/USD pair tested the $3,900 resistance on a couple occasions and later corrected lower. It declined below the $3,850 level, but downside were limited. The last swing low was formed at $3,831 before the price recovered above $3,840. There was a break above the 50% Fib retracement level of the recent slide from the $3,892 high to $3,831 low.
However, the price is currently facing a strong resistance near the $3,880 and $3,890 levels. Besides, the 76.4% Fib retracement level of the recent slide from the $3,892 high to $3,831 low is acting as a resistance. More importantly, there is a symmetrical triangle pattern formed with resistance at $3,880 on the hourly chart of the BTC/USD pair. Therefore, it seems like the pair is setting up for the next break, which could be above $3,880. If there is a successful close above $3,880 and $3,900, the price may surge higher towards the $4,000 resistance level.
An intermediate resistance is near the $3,930 level. It represents the 1.618 Fib extension level of the recent slide from the $3,892 high to $3,831 low. On the other hand, if the price fails to gain pace above $3,900, it could decline below the $3,850 support. The next main support is near the $3,820 level. If there are further losses, the price may perhaps test the $3,800 support and the 100 hourly simple moving average.
Looking at the chart, bitcoin price is preparing for the next ride either above $3,900 or below $3,800. There are higher chances of a break above $3,900 and $3,930 considering the current structure. If buyers remain in action, the price could even clear the $4,000 barrier in the coming sessions.
Technical indicators
Hourly MACD – The MACD is about to move back in the bullish zone.
Hourly RSI (Relative Strength Index) – The RSI for BTC/USD is placed well above the 50 level, with a positive angle.
Major Support Level – $3,820 followed by $3,800.
Major Resistance Level – $3,880, $3,900 and 4,000.


