
Reason to trust
How Our News is Made
Strict editorial policy that focuses on accuracy, relevance, and impartiality
Ad discliamer
Morbi pretium leo et nisl aliquam mollis. Quisque arcu lorem, ultricies quis pellentesque nec, ullamcorper eu odio.
- ETH price moved into a bearish zone and settled below the $128 and $127 supports against the US Dollar.
- The price traded towards the $122 level and it is currently consolidating losses.
- There is a crucial bearish trend line in place with resistance at $130 on the hourly chart of ETH/USD (data feed via Kraken).
- The pair could correct higher, but it is likely to find a strong selling interest near $127 and $128.
Ethereum price started a major decline against the US Dollar and bitcoin. ETH/USD is following a downtrend and it could continue to move down towards the $120 and $118 levels.
Ethereum Price Analysis
Recently, we saw a downside extension below the $130 support in ETH price against the US Dollar. The ETH/USD pair gained bearish momentum and broke the $126 and $125 support levels. It even traded below the $124 level and settled well below the 100 hourly simple moving average. A new monthly low was formed near $122 and the price is currently consolidating losses. It recovered above the $124 level and the 23.6% Fib retracement level of the recent drop from the $135 swing high to $122 swing low.
However, the previous support at $127 is acting as a solid resistance. Above $127, the $128 and $129 levels are waiting to prevent gains. There is also a crucial bearish trend line in place with resistance at $130 on the hourly chart of ETH/USD. Below the trend line, the 50% Fib retracement level of the recent drop from the $135 swing high to $122 swing low is near $129. Finally, the 100 hourly simple moving average is positioned near the $131 level.
Therefore, there are many resistances on the upside, starting with $127 and ending near $131. If the price corrects higher, it is likely to find a strong selling interest near $127 and $128. Once the current consolidation/correction pattern is complete, the price may resume its decline below $124. The next key support is positioned near the $120 level. If sellers remain in action, the price could even test the $118 level in the near term.
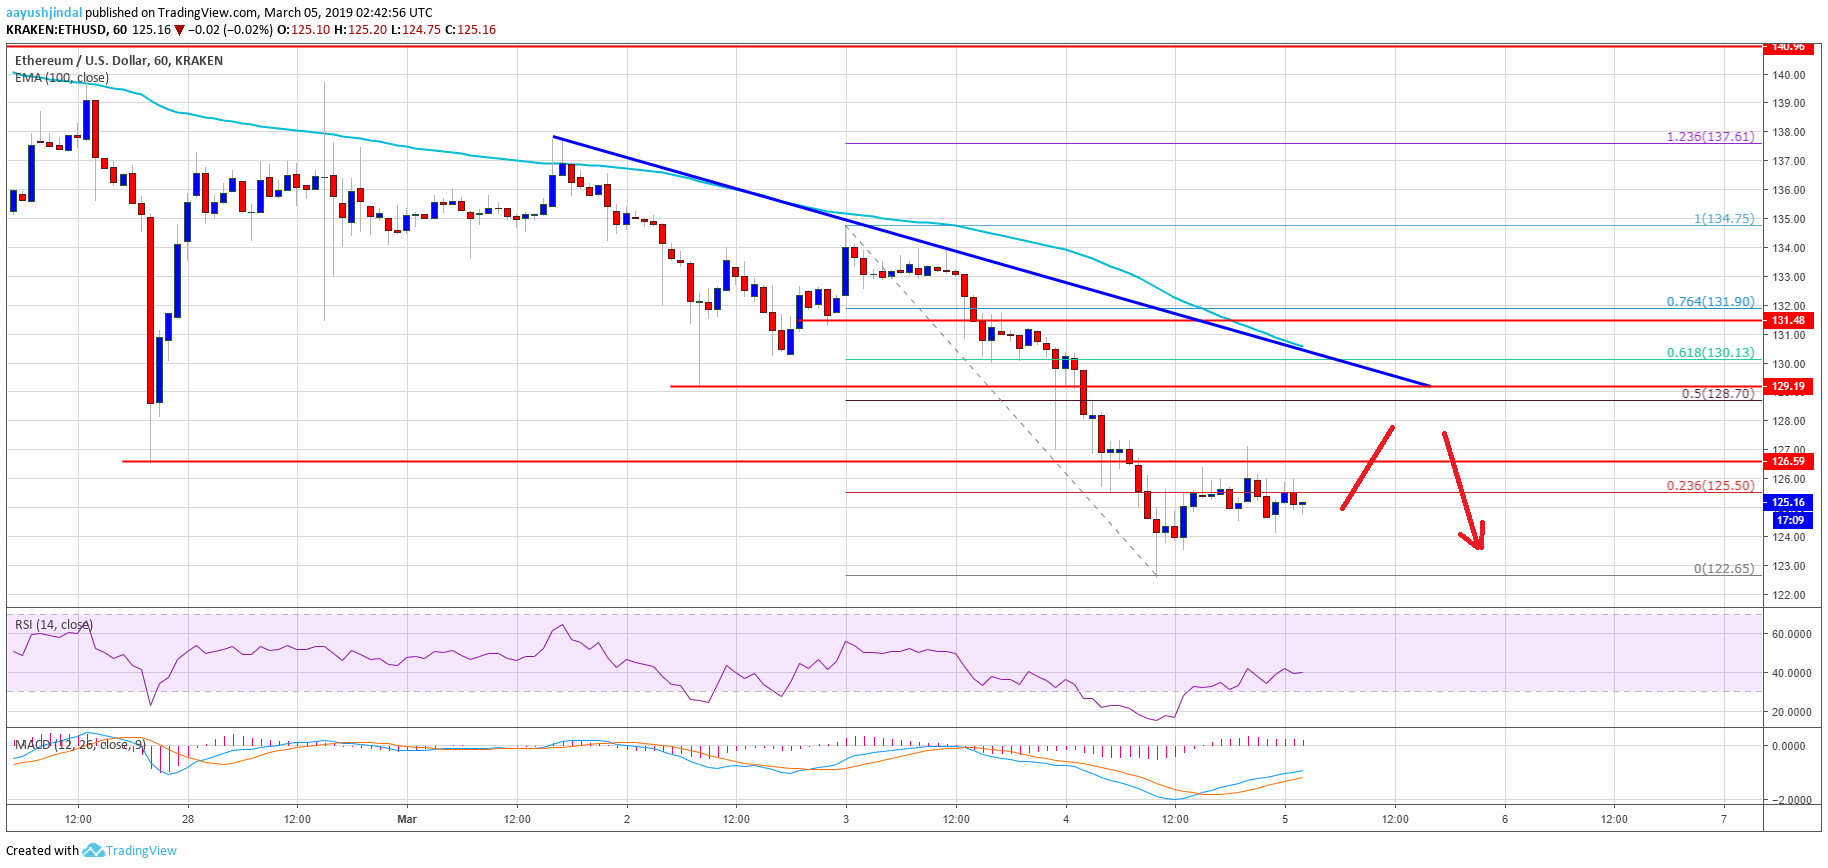
Looking at the chart, ETH price is trading heavily in the bearish zone below the $131 resistance. There could be short-term corrective moves, but upsides remain capped below $130 and $131. On the downside, buyers are likely to take a stand near the $120 and $118 levels in the coming sessions.
ETH Technical Indicators
Hourly MACD – The MACD for ETH/USD is about to move back in the bearish zone.
Hourly RSI – The RSI for ETH/USD is slowly recovering, but it is still well below the 50 and 45 levels.
Major Support Level – $120
Major Resistance Level – $130


