
Reason to trust
How Our News is Made
Strict editorial policy that focuses on accuracy, relevance, and impartiality
Ad discliamer
Morbi pretium leo et nisl aliquam mollis. Quisque arcu lorem, ultricies quis pellentesque nec, ullamcorper eu odio.
- Ripple price failed to gain momentum above the $0.3150 resistance and declined against the US dollar.
- The price is now trading well below the $0.3140 resistance and the 100 hourly simple moving average.
- There is a crucial contracting triangle in place with resistance near the $0.3095 level on the hourly chart of the XRP/USD pair (data source from Kraken).
- The pair could dip sharply towards the $0.3020 support before it attempts a solid recovery.
Ripple price trading with a bearish angle against the US Dollar and bitcoin. XRP/USD remains at a risk of more losses before it could bounce back above $0.3120 and $0.3140.
Ripple Price Analysis
This past week, we saw a decent recovery from the $0.2980 swing low in ripple price against the US Dollar. The XRP/USD pair broke the $0.3100 and $0.3150 resistance levels to climb above $0.3200. It traded as high as $0.3232 and later started a downside move. There was a bearish push below the $0.3150 support and the 100 hourly simple moving average. The price broke the 50% Fib retracement level of the last wave from the $0.2981 low to $0.3232 high. It opened the doors for more losses and the price declined below $0.3100.
At the outset, the price is testing an important support near the $0.3070 level. If there is a downside break below $0.3070, the price could decline towards $0.3040. It represents the 76.4% Fib retracement level of the last wave from the $0.2981 low to $0.3232 high. More importantly, there is a crucial contracting triangle in place with resistance near the $0.3095 level on the hourly chart of the XRP/USD pair. The pair could dip sharply below the triangle support and test $0.3040 in the near term.
On the upside, if there is a break above the triangle, the price may test the $0.3130 resistance and 100 hourly simple moving average. Having said that, a proper break and close above $0.3150 is must for buyers to gain traction. The next key resistance is at $0.3200 and $0.3220.
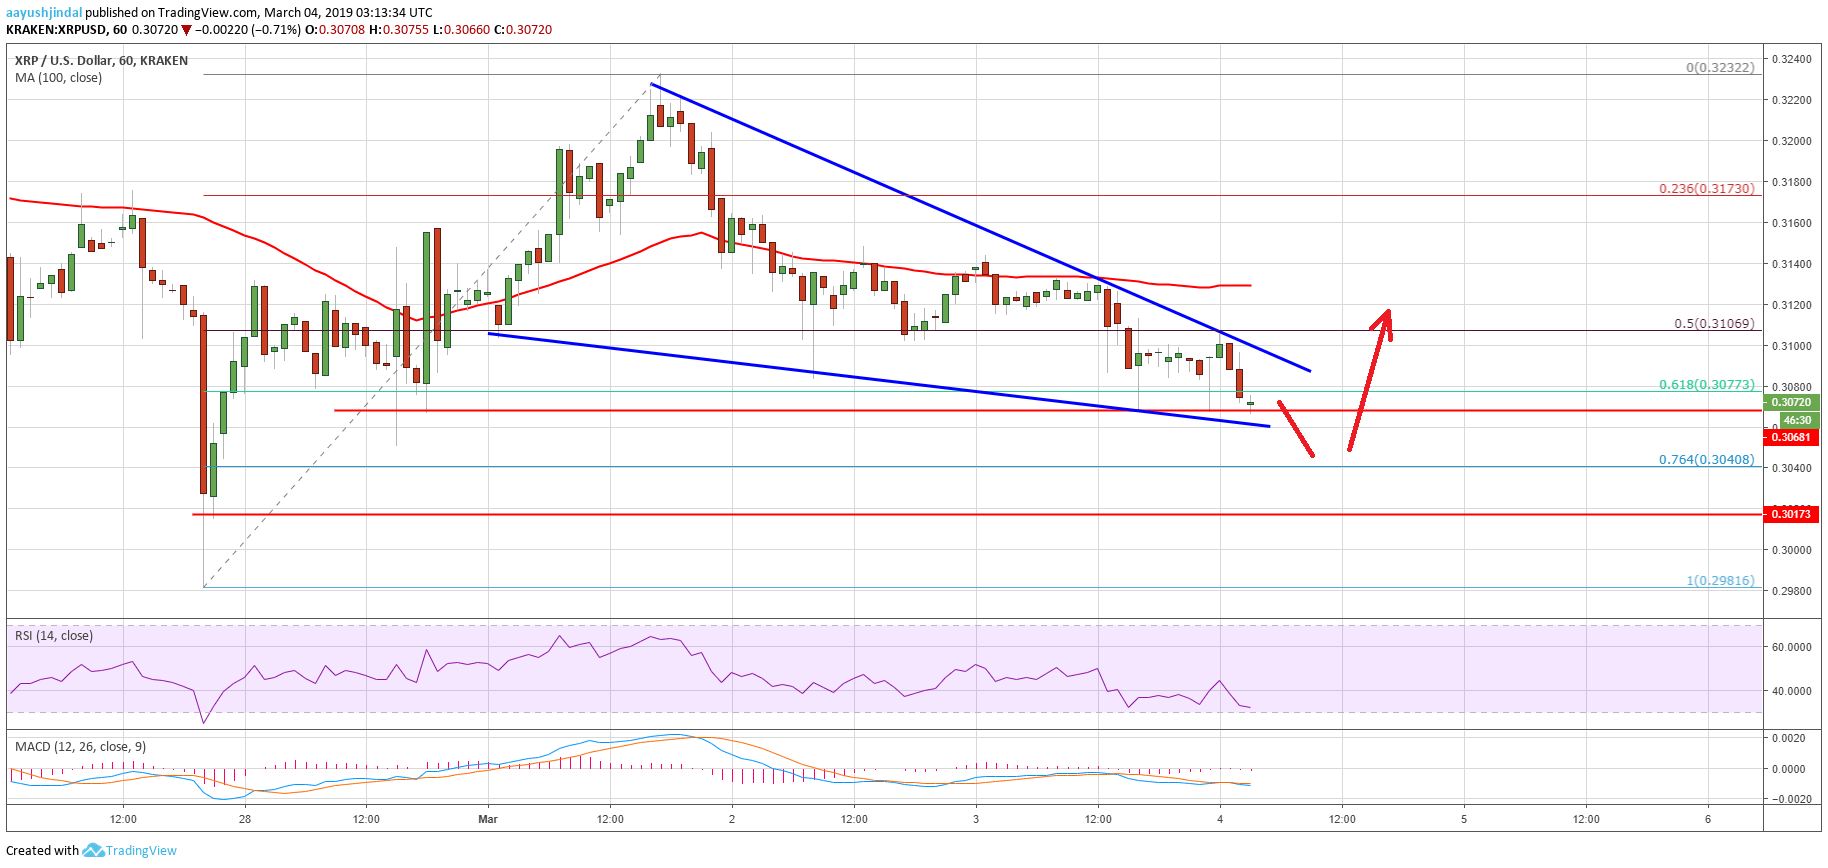
Looking at the chart, ripple price is currently in a bearish zone below $0.3140. Therefore, there is a risk of a sharp drop towards the $0.3020 support before XRP attempts a solid recovery. Should buyers fail to defend the $0.3020 support, the price could break the last swing low at $0.2981. The next main support is at $0.2950 and $0.2920.
Technical Indicators
Hourly MACD – The MACD for XRP/USD is slowly gaining momentum in the bearish zone.
Hourly RSI (Relative Strength Index) – The RSI for XRP/USD is now well below the 40 level, with a bearish bias.
Major Support Levels – $0.3070, $0.3040 and $0.3020.
Major Resistance Levels – $0.3100, $0.3140 and $0.3150.


