
Reason to trust
How Our News is Made
Strict editorial policy that focuses on accuracy, relevance, and impartiality
Ad discliamer
Morbi pretium leo et nisl aliquam mollis. Quisque arcu lorem, ultricies quis pellentesque nec, ullamcorper eu odio.
- ETH price made many swing highs and later declined below the $131 support against the US Dollar.
- The price is now trading well below the $135 resistance and the 100 hourly simple moving average.
- There was a break below a major triangle with support at $131 on the hourly chart of ETH/USD (data feed via Kraken).
- The pair could continue to move down and it could test the $126 or $125 support level in the near term.
Ethereum price is under pressure below key resistances against the US Dollar and bitcoin. ETH/USD remains a sell until buyers manage to push the price above the $134-135 resistance area.
Ethereum Price Analysis
This past week, we saw how ETH price struggled near the $139 and $140 resistances against the US Dollar. The ETH/USD pair made many attempts to break higher towards $145, but it failed. Recently, it formed many swing highs such as $140, $138 and $135 before it started a downside move. Sellers gained pace below the $134 support, with a strong negative angle. There was a sharp drop below the $130 support and the price settled well below the 100 hourly simple moving average.
During the decline, there was a break below a major triangle with support at $131 on the hourly chart of ETH/USD. The pair even broke the $128 support and traded close to the $127 level. Later, there was a minor bounce above the $128 level. The price recovered above the 23.6% Fib retracement level of the recent decline from the $135 swing high to $127 low. However, the recovery remained capped by the $130 zone. It seems like there is a strong resistance formed near the $131 zone. Besides, the 50% Fib retracement level of the recent decline from the $135 swing high to $127 low is also near $131.
Above the $131 resistance, the next key resistance is near the $134 and $135 levels. More importantly, buyers need to push the price above $136 and the 100 hourly SMA for a sustained move higher. If they fail, there are chances of more losses below the $127 swing low.
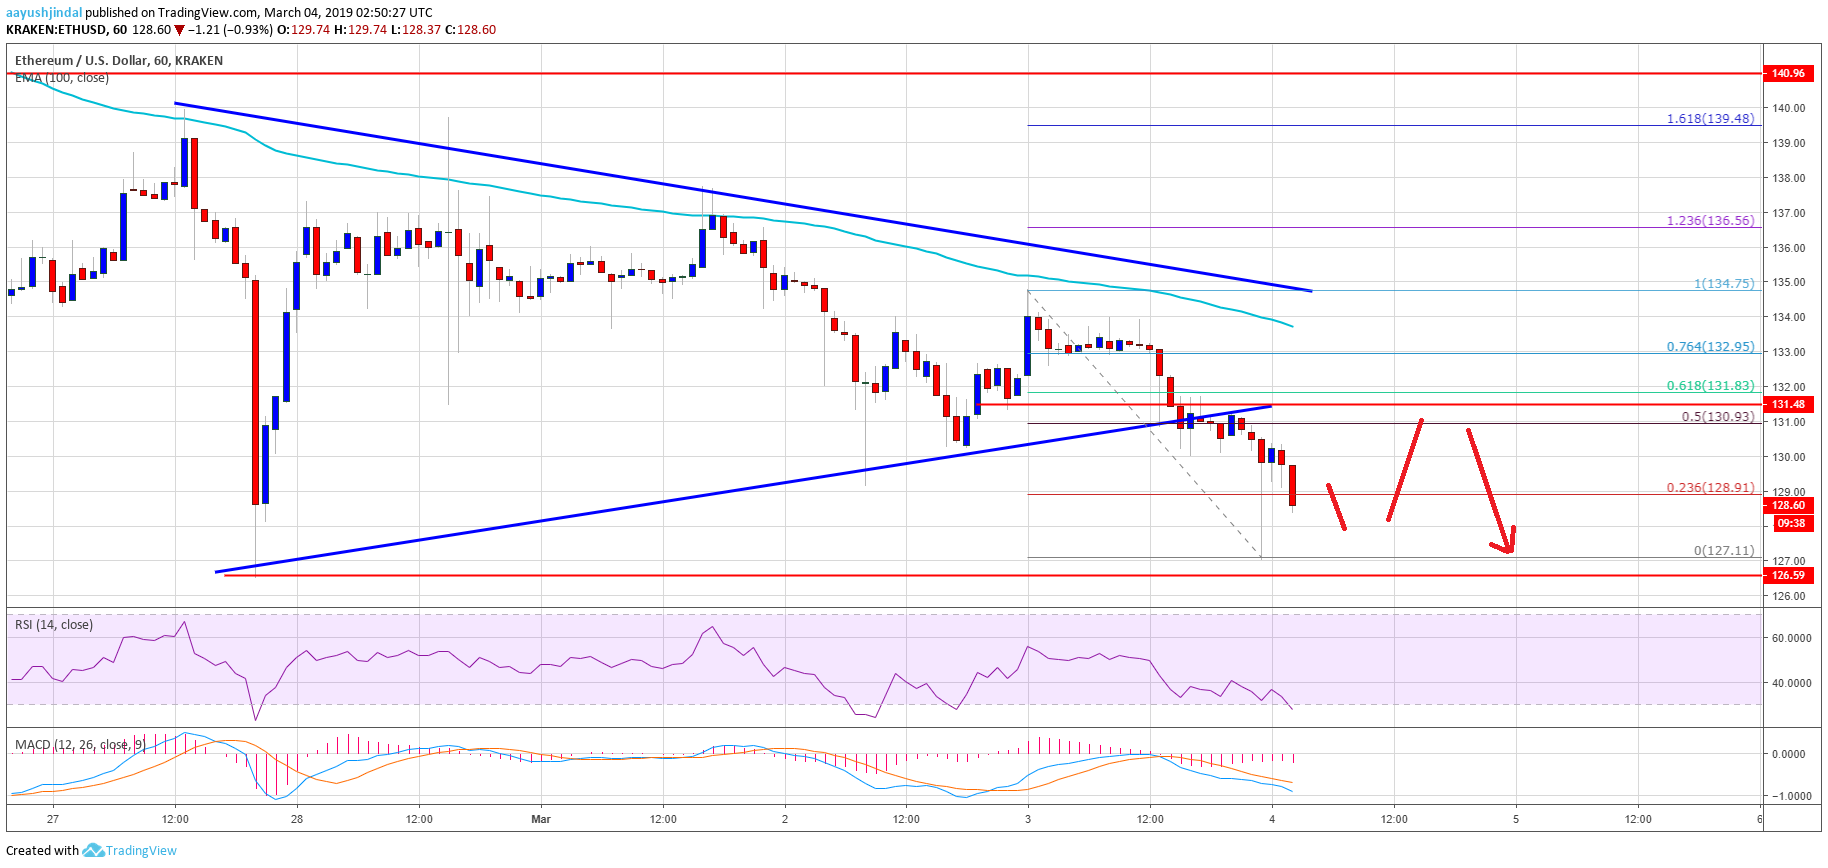
Looking at the chart, ETH price is clearly trading in a bearish zone below the $134 and $131 resistance levels. There could be a short term upside correction, but sellers remain in control below $134. On the downside, an initial support is at $126, followed by the $125 pivot level.
ETH Technical Indicators
Hourly MACD – The MACD for ETH/USD is placed heavily in the bearish zone.
Hourly RSI – The RSI for ETH/USD moved down sharply below the 30 level, with a bearish angle.
Major Support Level – $126
Major Resistance Level – $134


