
Reason to trust
How Our News is Made
Strict editorial policy that focuses on accuracy, relevance, and impartiality
Ad discliamer
Morbi pretium leo et nisl aliquam mollis. Quisque arcu lorem, ultricies quis pellentesque nec, ullamcorper eu odio.
- ETH price finally broke the $149 and $150 resistance levels and gained pace against the US Dollar.
- The price traded above the $160 resistance and formed a new 2019 high above $165.
- There is a major bullish trend line formed with support near $148 on the 4-hours chart of ETH/USD (data feed via Kraken).
- The pair remains in a strong uptrend and it could accelerate towards the $175 level in the near term.
Ethereum price gained bullish momentum above key resistances versus the US Dollar and Bitcoin. ETH/USD might continue to rise and it could even break the $170 and $175 levels.
Ethereum Price Analysis
This past week, we saw a brief consolidation pattern below the $150 resistance in ETH price against the US Dollar. The ETH/USD pair made many attempts to break the $149 and $150 resistance levels, but it failed. There was even a downside correction below the $146 and $145 supports. However, the $138 level acted as a strong support and the price was well above the 100 simple moving average (4-hours). Finally, buyers gained pace and were able to break the $149 and $150 resistance levels.
It broke the $154 resistance as well and climbed above the $160 resistance. More importantly, the price traded to a new 2019 high above the $165 level. A high was formed at $166 and the price is currently correcting lower. An initial support is near the 23.6% Fib retracement level of the last wave from the $139 low to $166 high. However, there are many supports on the downside near the $155 and $153 levels. Moreover, the 50% Fib retracement level of the last wave from the $139 low to $166 high is also placed near the $153 level. Finally, there is a major bullish trend line formed with support near $148 on the 4-hours chart of ETH/USD.
Clearly, the price remains well supported above the $153 support. The main support on the downside could be $151 and the 61.8% Fib retracement level of the last wave from the $139 low to $166 high. On the upside, an initial resistance is near the $168 and $170 levels. If there is a break above the $170 level, the price could test the $175 level.
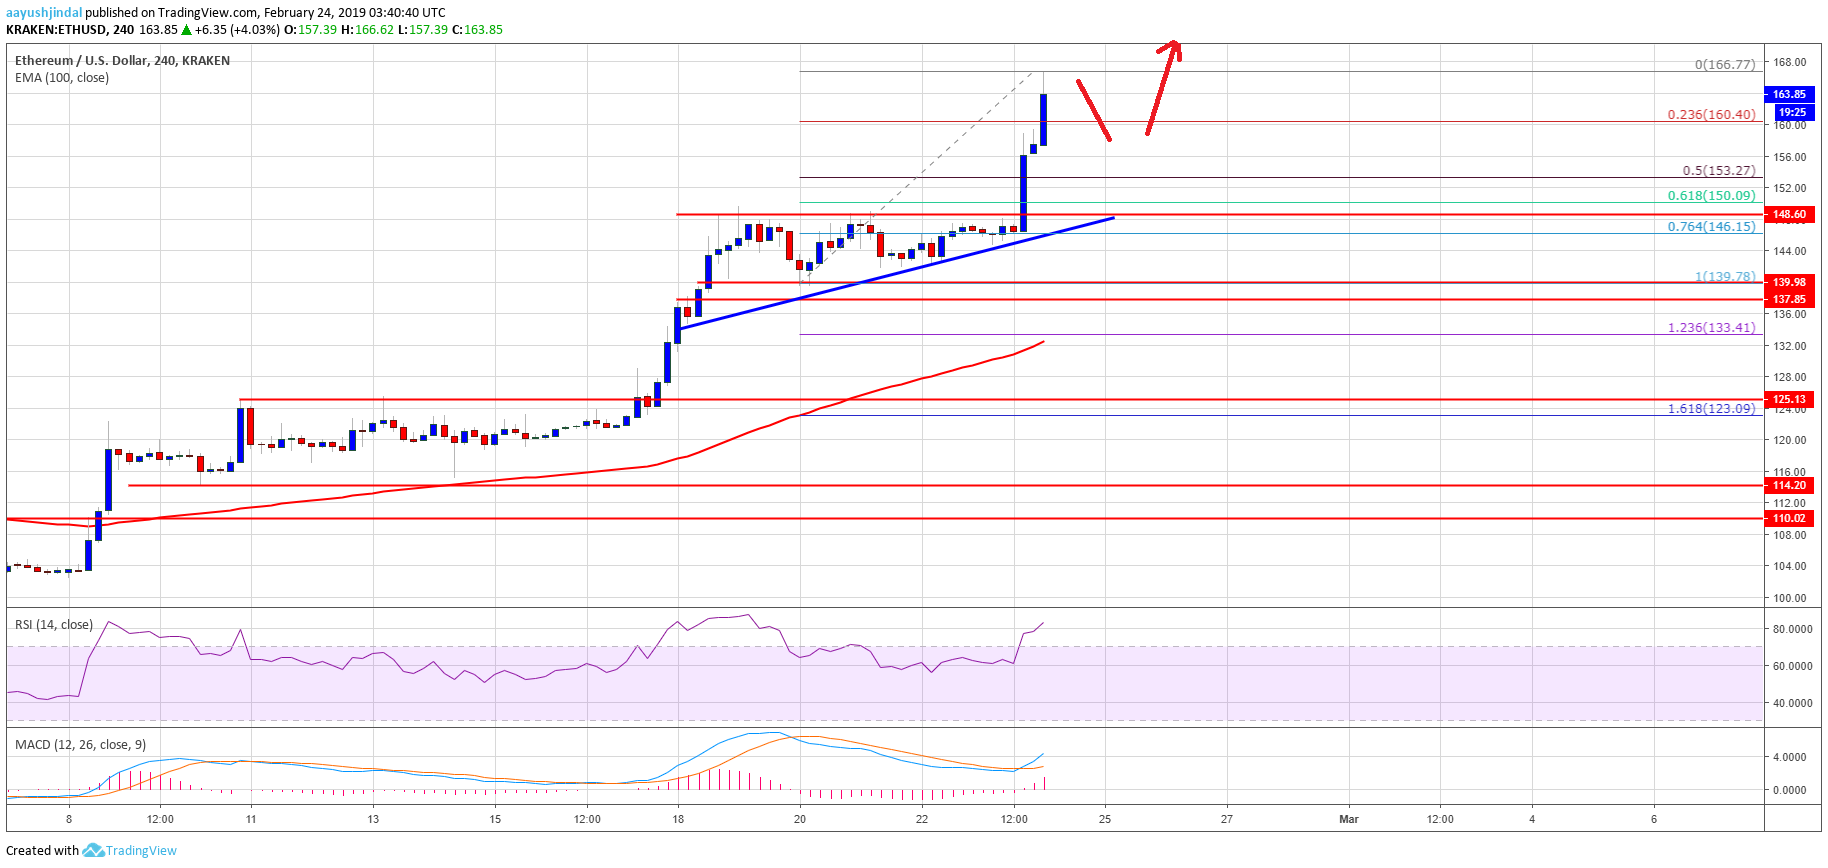
The above chart indicates that ETH price is placed in a strong uptrend above the $155, $153 and $151 support levels. Therefore, there are chances of more gains above the $170 level.
Technical Indicators
4 hours MACD – The MACD for ETH/USD is gaining momentum in the bullish zone.
4 hours RSI – The RSI for ETH/USD is currently well above the 70 level.
Major Support Level – $151
Major Resistance Level – $170


