
Reason to trust
How Our News is Made
Strict editorial policy that focuses on accuracy, relevance, and impartiality
Ad discliamer
Morbi pretium leo et nisl aliquam mollis. Quisque arcu lorem, ultricies quis pellentesque nec, ullamcorper eu odio.
- Bitcoin price extended gains above $3,900 and traded close to the $4,000 resistance against the US Dollar.
- The price traded as high as $3,973 and later started a downside correction.
- There is a short term breakout pattern in place with support at $3,875 on the hourly chart of the BTC/USD pair (data feed from Kraken).
- The pair is likely to correct further lower towards the $3,830 or $3,800 support levels before fresh increase.
Bitcoin price failed to surpass the $4,000 resistance and corrected lower against the US Dollar. BTC could tested the $3,800 support area before a new upward move towards $4,000.
Bitcoin Price Analysis
Yesterday, we saw a strong rally above the $3,750 resistance in bitcoin price against the US Dollar. The BTC/USD pair spiked towards the $3,950 level and later corrected lower. However, the $3,830 support prevented losses and the price bounced back. It broke the last swing high and traded close to the $4,000 resistance. A new weekly high was formed at $3,973, but the price failed to test the $4,000 barrier. As a result, there was a fresh downside correction and the price declined below $3,950 and $3,920.
There was a break below the 23.6% Fib retracement level of the last wave from the $3,684 low to $3,973 high. However, the current decline is finding bids near yesterday’s highlighted bullish trend line with support at $3,880. More importantly, it seems like there is a short term breakout pattern in place with support at $3,875 on the hourly chart of the BTC/USD pair. If there is a downside break, the pair could test the next key support at $3,830. It coincides with the 50% Fib retracement level of the last wave from the $3,684 low to $3,973 high.
If the price fails to hold the $3,830 support, it could test the main $3,800 support area in the near term. On the upside, the price must break the $3,925 and $3,950 resistance levels to revisit $3,975. The main resistance for buyers is near the $4,000 level, above which there are chances of further gains.
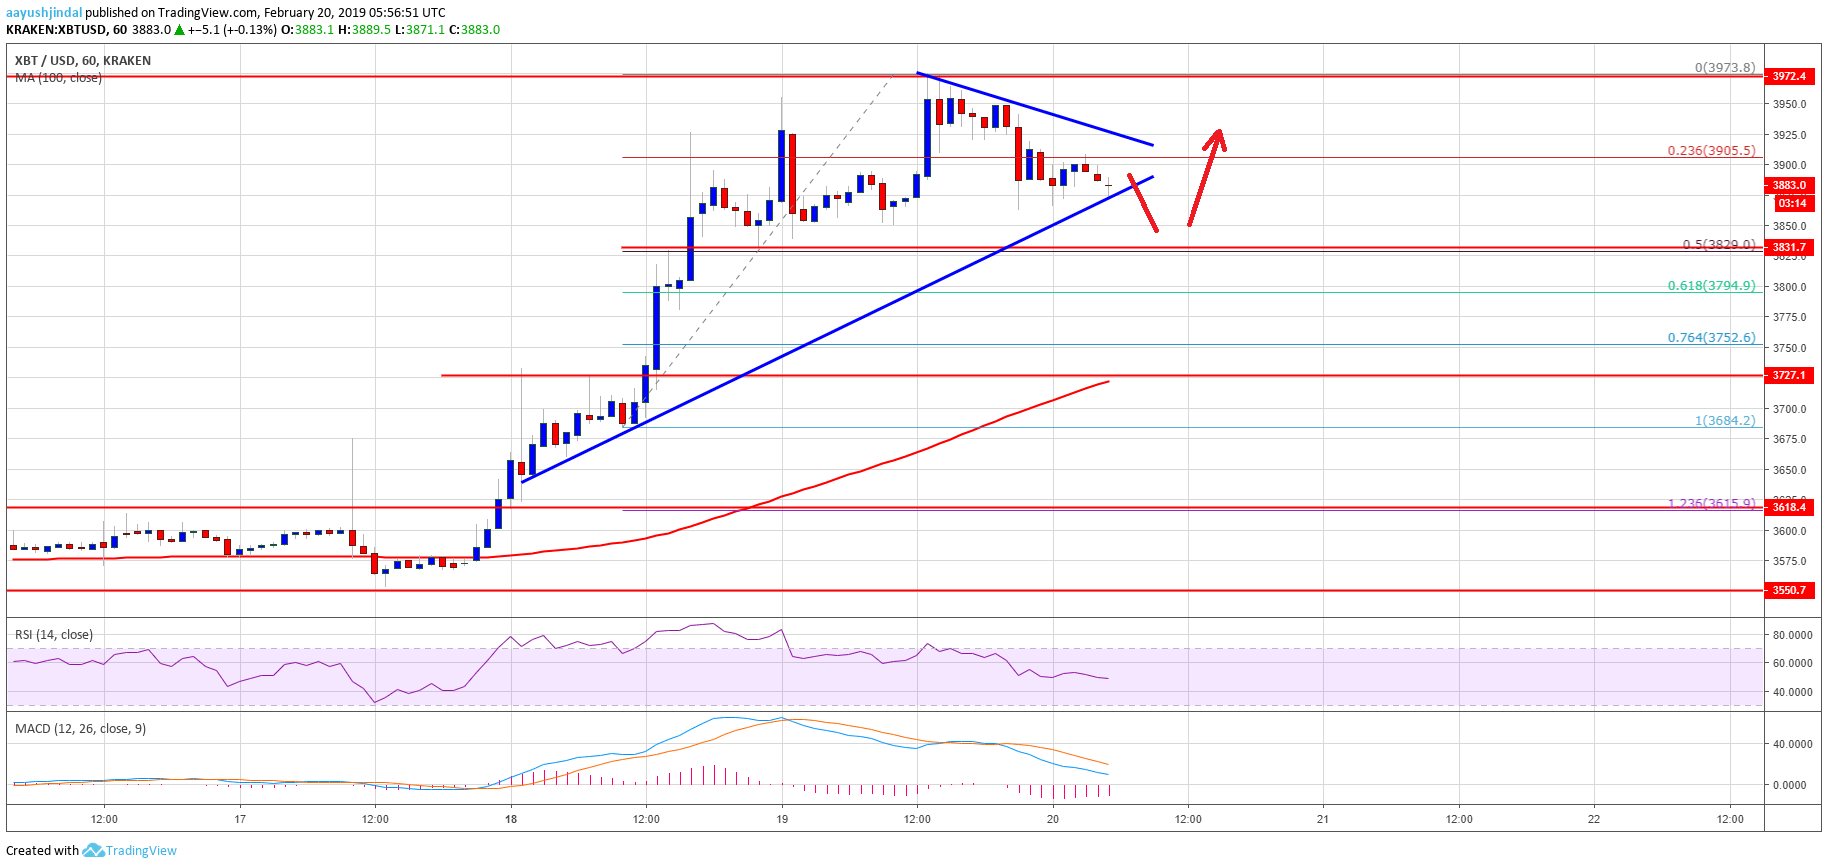
Looking at the chart, bitcoin price seems to be setting up for the next break either above $3,925 or below $3,875. In the short term, there could be a few bearish moves, but the $3,800 support is likely to hold losses. Below $3,800, the price could drop towards the $3,720 support.
Technical indicators
Hourly MACD – The MACD is currently in the bearish zone, with a few positive signs.
Hourly RSI (Relative Strength Index) – The RSI for BTC/USD is currently flat near the 50 level.
Major Support Level – $3,830 followed by $3,800.
Major Resistance Level – $3,925. $3,950 and 4,000.


