
Reason to trust
How Our News is Made
Strict editorial policy that focuses on accuracy, relevance, and impartiality
Ad discliamer
Morbi pretium leo et nisl aliquam mollis. Quisque arcu lorem, ultricies quis pellentesque nec, ullamcorper eu odio.
- Ripple price formed a solid support near the $0.2940 and traded higher against the US dollar.
- There was a break above two key bearish trend lines with resistance near $0.2980 on the hourly chart of the XRP/USD pair (data source from Kraken).
- The price tested the $0.3040 and $0.3050 resistance levels, where sellers emerged.
- In the short term, there could be a minor downside correction before the price spikes above $0.3050 and $0.3080.
Ripple price is holding a few important supports against the US Dollar and Bitcoin. XRP/USD is likely to gain bullish momentum once buyers surpass the $0.3080 and $0.3100 resistance levels.
Ripple Price Analysis
After a few bearish moves, ripple price formed a solid support near the $0.2940 level against the US Dollar. The XRP/USD pair started a decent upside correction and traded above the $0.2960 and $0.2980 resistance levels. During the climb, the price broke the 50% Fib retracement level of the last drop from the $0.3088 high to $0.2940 low. It opened the doors for more gains above the $0.2980 resistance. Later, the price settled above the $0.3000 resistance and the 100 hourly simple moving average.
Besides, there was a break above two key bearish trend lines with resistance near $0.2980 on the hourly chart of the XRP/USD pair. The pair traded close to the $0.3040 and $0.3050 resistance levels, where sellers emerged. The recent high was formed at $0.3044 and the price is currently consolidating. An initial support is near the 23.6% Fib retracement level of the recent wave from the $0.2940 low to $0.3044 high. However, the main support is near the $0.3000 level, which was a crucial resistance earlier.
The next support is near the $0.2990 level and the 50% Fib retracement level of the recent wave from the $0.2940 low to $0.3044 high. More importantly, the 100 hourly SMA is also near the $0.2900 level to act as a solid support in the near term. To the upside, an initial resistance is near the $0.3050 level, followed by $0.3080. The main resistance is close to the $0.3100 level, above which buyers are likely to gain strength.
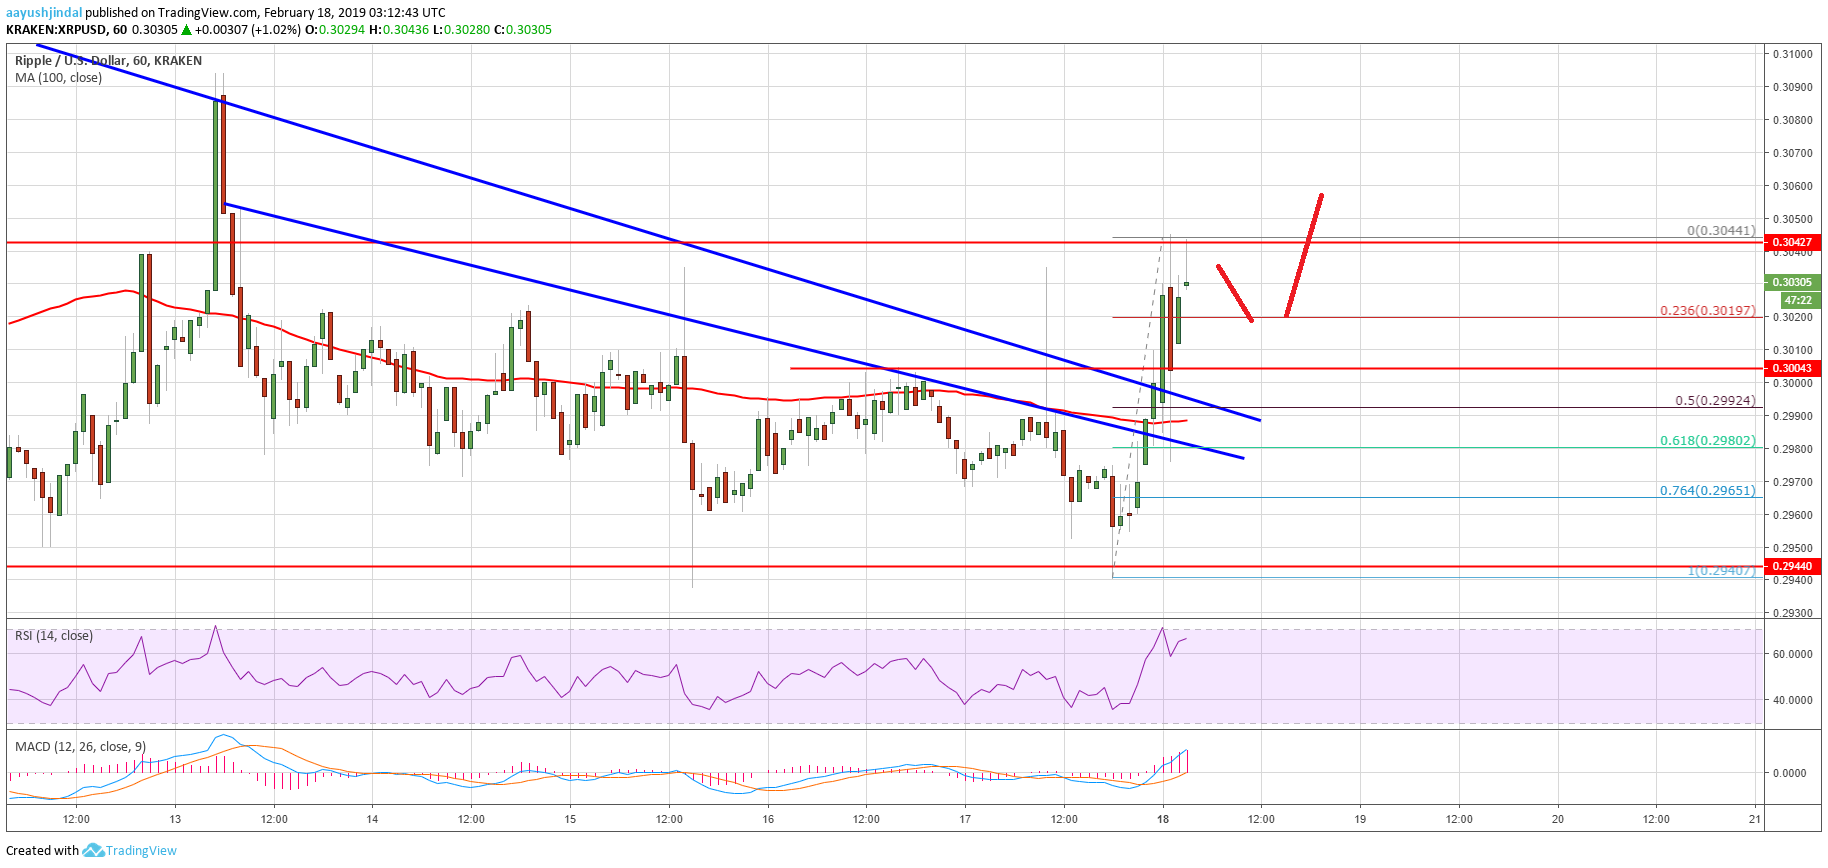
Looking at the chart, ripple price seems to be placed nicely above the $0.3000 support. However, a proper break above $0.3040 and $0.3050 is needed for more gains. In the short term, there could be a few bearish moves, but the price is likely to gain pace above $0.3050 and $0.3080
Technical Indicators
Hourly MACD – The MACD for XRP/USD is gaining momentum in the bullish zone.
Hourly RSI (Relative Strength Index) – The RSI for XRP/USD is currently just placed well above the 60 level.
Major Support Level – $0.2990
Major Resistance Level – $0.3080


