
Reason to trust
How Our News is Made
Strict editorial policy that focuses on accuracy, relevance, and impartiality
Ad discliamer
Morbi pretium leo et nisl aliquam mollis. Quisque arcu lorem, ultricies quis pellentesque nec, ullamcorper eu odio.
- Ripple price is struggling to clear the $0.3000 and $0.3100 resistance levels against the US dollar.
- There is a crucial bearish trend line formed with resistance at $0.3000 on the 4-hours chart of the XRP/USD pair (data source from Kraken).
- The pair must gain momentum above $0.3000 and the 100 simple moving average (4-hours) for more gains.
- On the downside, a break below the $0.2940 support could trigger bearish moves in the near term.
Ripple price corrected lower after a decent upward move against the US Dollar and bitcoin. XRP/USD is likely to make the next move either above $0.3000 or below $0.2900.
Ripple Price Analysis
After forming a support near the $0.2850 level, ripple price made a nice upward move against the US Dollar. The XRP/USD pair rallied and broke the $0.3000 and $0.3150 resistance levels. The price traded close to the $0.3200 level, where sellers emerged. A high was formed at $0.3198 before the price started a downside correction. There was a sharp decline below the $0.3100 and $0.3000 support levels. Sellers pushed the price below the 50% Fib retracement level of the last wave from the $0.2853 low to $0.3198 high. Besides, there was a close below the $0.3000 level and the 100 simple moving average (4-hours).
Similarly, there were bearish moves in bitcoin, Ethereum, eos, litecoin and other altcoins. Later, ripple found support near the $0.2940 and $0.2950 levels. It traded close to the 76.4% Fib retracement level of the last wave from the $0.2853 low to $0.3198 high. Finally, the price started trading in a range between the $0.2940 and $0.3050 levels. On the upside, there is a crucial bearish trend line formed with resistance at $0.3000 on the 4-hours chart of the XRP/USD pair. Therefore, a break above the trend line and $0.3040 could open the doors for more gains. The next key resistance is near the $0.3110 level, above which the price may test $0.3200.
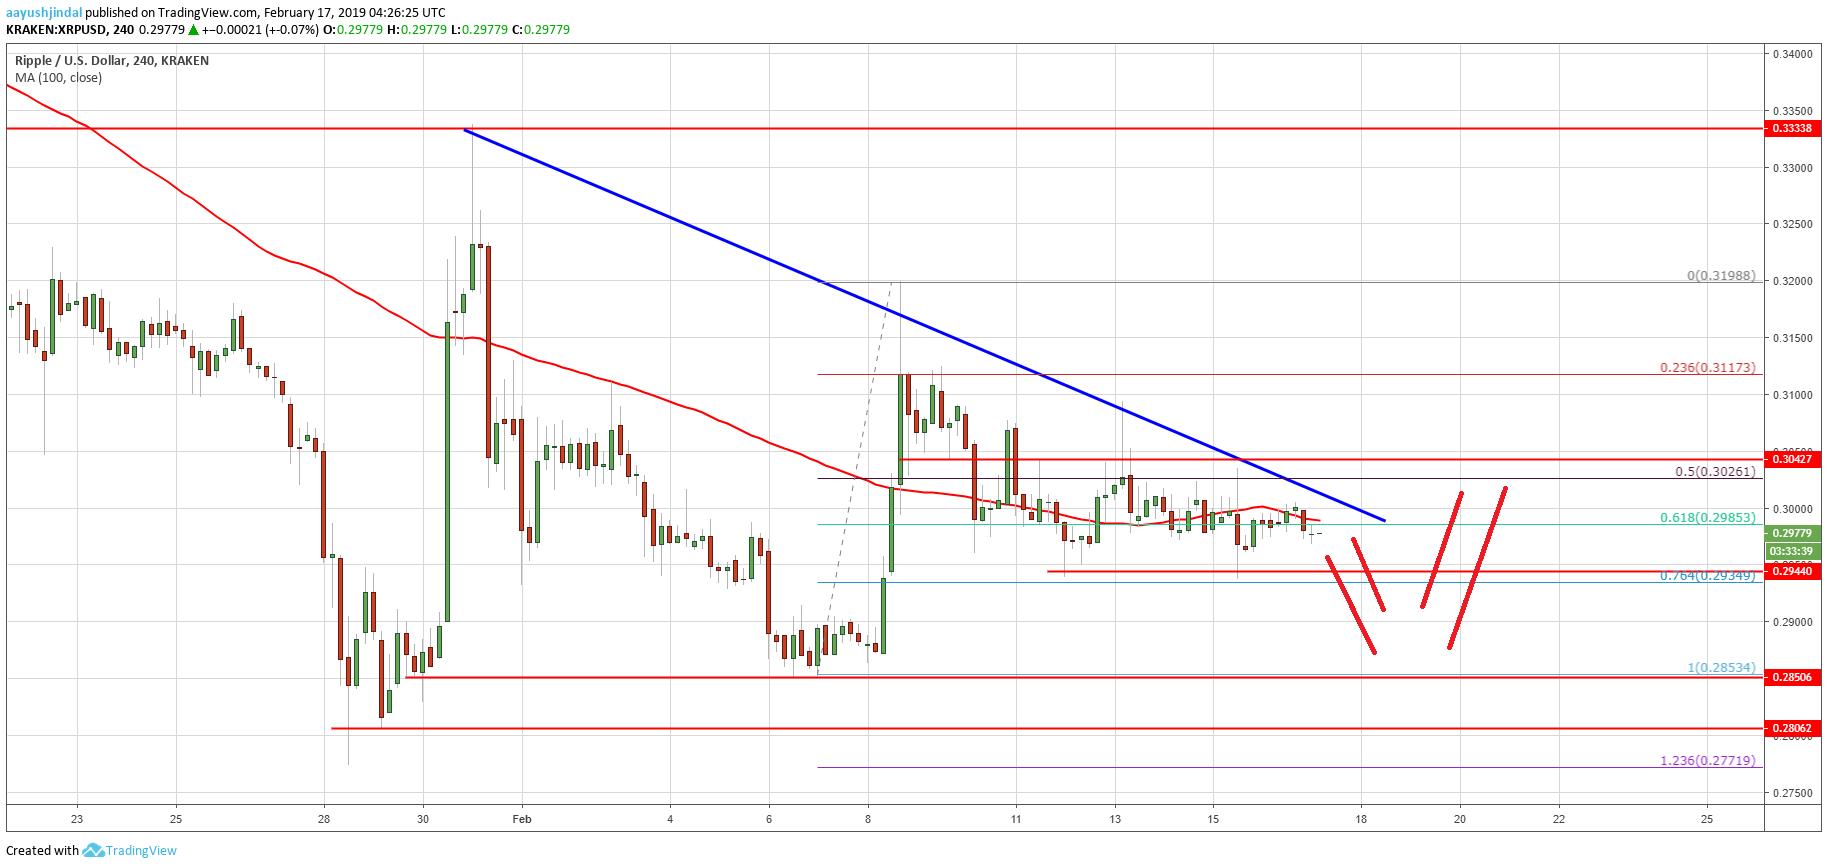
Looking at the chart, ripple price seems to be trading in a range above $0.2940 and preparing the next move. If there is a downside break below $0.2940, the price could test the $0.2850 support area. The next key support is near $0.2770 and the 1.236 Fib extension level of the last wave from the $0.2853 low to $0.3198 high. The overall price action is slightly bearish, but the $0.2940 support might continue to hold losses.
Technical Indicators
4 hours MACD – The MACD for XRP/USD is showing a few bearish signs in the bearish zone.
4 hours RSI (Relative Strength Index) – The RSI for XRP/USD just moved below the 50 level.
Major Support Level – $0.2940
Major Resistance Level – $0.3000


