
Reason to trust
How Our News is Made
Strict editorial policy that focuses on accuracy, relevance, and impartiality
Ad discliamer
Morbi pretium leo et nisl aliquam mollis. Quisque arcu lorem, ultricies quis pellentesque nec, ullamcorper eu odio.
- Ripple price started a downside correction and traded below the $0.3050 support against the US dollar.
- There is a major declining channel in place with resistance near $0.3040 on the hourly chart of the XRP/USD pair (data source from Kraken).
- The pair is under pressure and it seems to be approaching the key $0.2915 support area.
Ripple price corrected most its gains against the US Dollar and Bitcoin. XRP/USD settled below $0.3050 and it could extend the current correction towards the $0.2915 support area.
Ripple Price Analysis
Recently, ripple price started a downside correction after trading as high as $0.3200 against the US Dollar. The XRP/USD pair traded below the $0.3100 and $0.3050 support levels. Sellers pushed the price below the $0.3000 support and the 100 hourly simple moving average. Besides, there was a break below the 61.8% Fib retracement level of the last leg from the $0.2865 low to $0.3200 high. It seems like the price trimmed most of its recent gains and it could extend the decline to $0.2915 in the near term.
It traded as low as $0.2939 recently and it is currently correcting higher. An initial resistance is near the $0.3000 level and the 100 hourly SMA. Besides, the 50% Fib retracement level of the recent drop from the $0.3077 high to $0.2939 low is also near $0.3000. Above this, the price could struggle near the $0.3025 level. The main resistance is near $0.3050 and the 76.4% Fib retracement level of the recent drop from the $0.3077 high to $0.2939 low. Finally, there is a major declining channel in place with resistance near $0.3040 on the hourly chart of the XRP/USD pair.
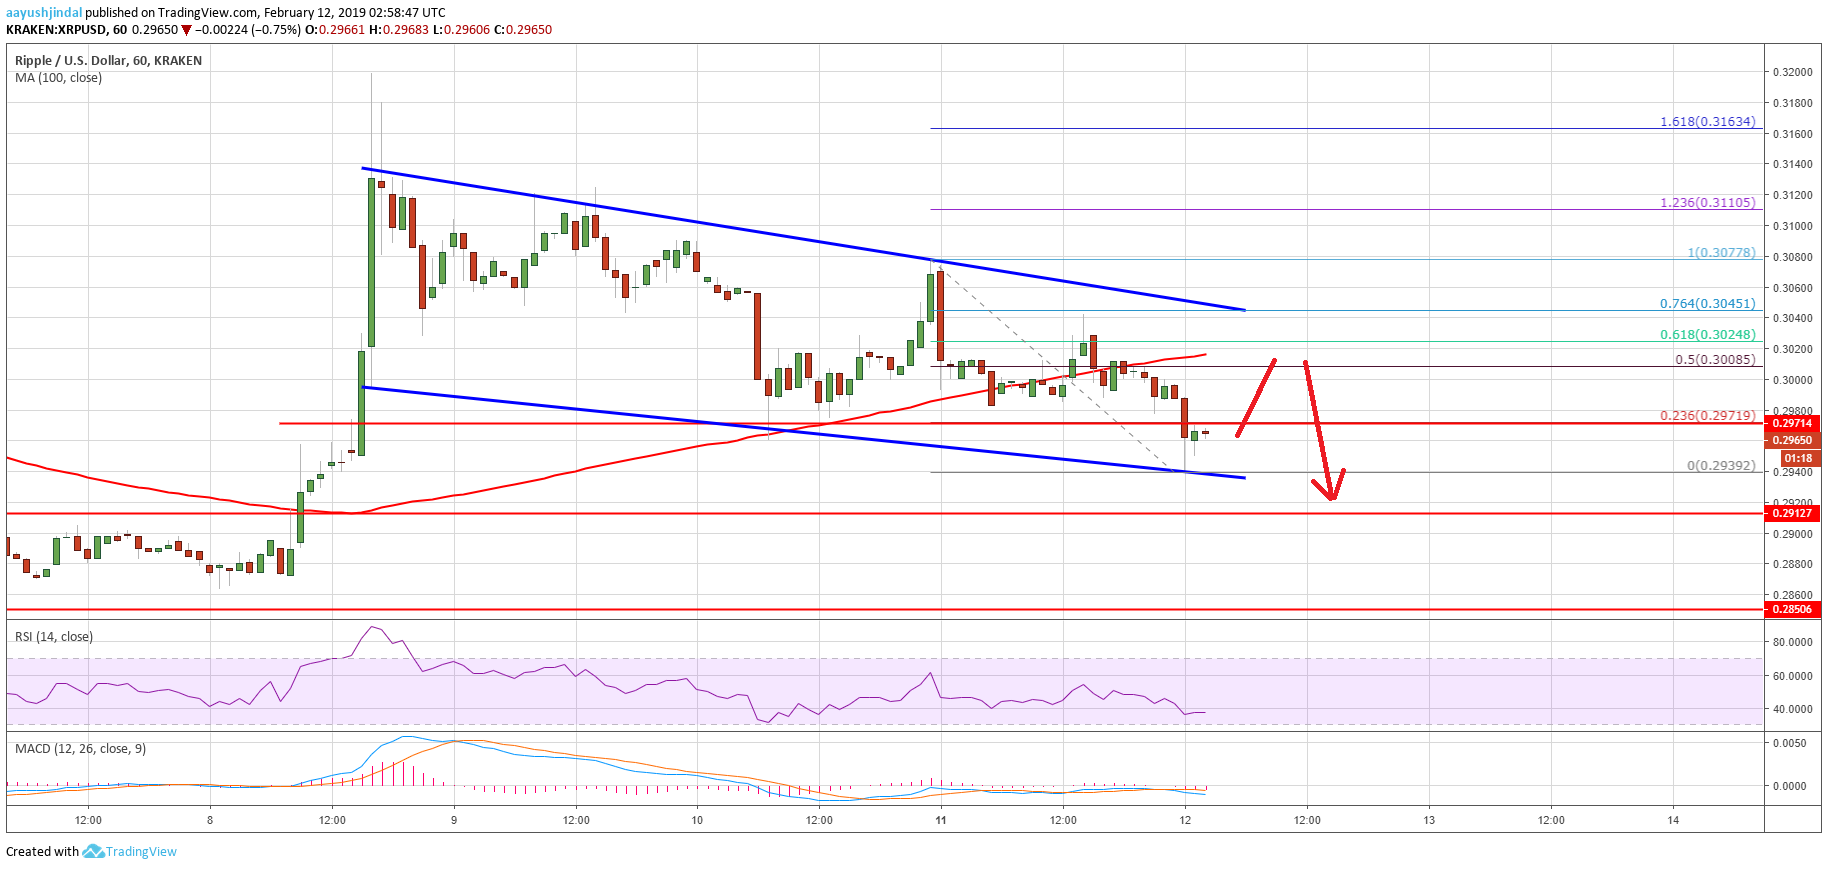
Looking at the chart, ripple price is clearly following a declining pattern from the $0.3200 swing high. The price could remain under pressure and it may even slide towards the $0.2915 support. To recover, the price must break the $0.3000 and $0.3050 resistance levels.
Technical Indicators
Hourly MACD – The MACD for XRP/USD is currently placed in the bearish zone.
Hourly RSI (Relative Strength Index) – The RSI for XRP/USD moved below the 40 level, with a bearish angle.
Major Support Level – $0.2915
Major Resistance Level – $0.3050


