
Reason to trust
How Our News is Made
Strict editorial policy that focuses on accuracy, relevance, and impartiality
Ad discliamer
Morbi pretium leo et nisl aliquam mollis. Quisque arcu lorem, ultricies quis pellentesque nec, ullamcorper eu odio.
- Ripple price bounced back sharply and broke the $0.3000 resistance level against the US dollar.
- There was a break above a major bearish trend line with resistance near $0.2900 on the 4-hours chart of the XRP/USD pair (data source from Kraken).
- The pair is now placed nicely above the $0.3000 support and the 100 simple moving average (4-hours).
Ripple price gained a strong bullish momentum against the US Dollar and bitcoin. XRP/USD is likely to extend the current wave towards the $0.3300 or $0.3400 resistance level.
Ripple Price Analysis
Recently, we saw a strong upward move above the $0.3250 level in ripple price against the US Dollar. However, the XRP/USD pair failed to break the $0.3340 level and declined sharply. It trimmed most its gains and revisited the $0.2850 support level. A strong support was formed near $0.2850, with a positive angle. Later, bitcoin, Ethereum, eos, litecoin and other altcoins rallied, which helped ripple to gain traction above the $0.3000 resistance. There was a solid upward move, with a close above $0.3000 and the 100 simple moving average (4-hours).
The price broke the 50% Fib retracement level of the last decline from the $0.3370 high to $0.2849 low. More importantly, there was a break above a major bearish trend line with resistance near $0.2900 on the 4-hours chart of the XRP/USD pair. The pair tested the $0.3180-0.3200 resistance area, where sellers emerged. Besides, there was a spike above the 61.8% Fib retracement level of the last decline from the $0.3370 high to $0.2849 low. Later, the price corrected lower and traded below the $0.3120 level.
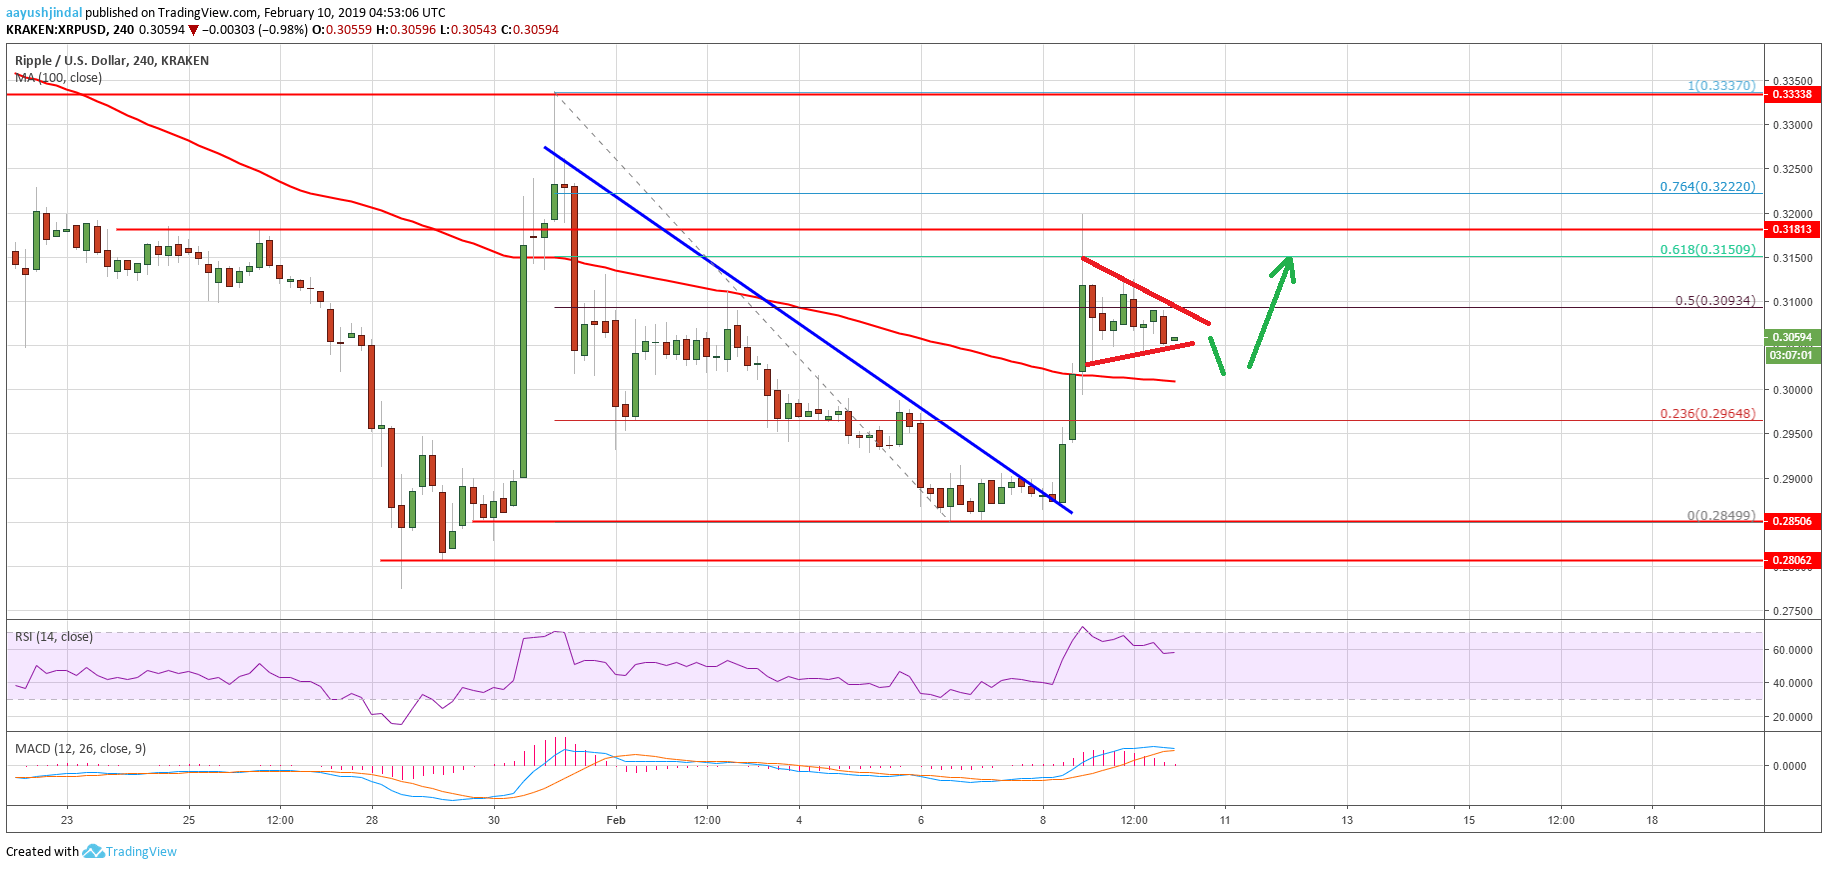
Looking at the chart, ripple price is currently trading in a short term triangle with resistance at $0.3110. There could be a few swing moves, but the price may perhaps extend gains above the $0.3180-0.3200 resistance area. The next stop for buyers could be either $0.3320 or $0.3420 in the coming sessions.
Technical Indicators
4-hours MACD – The MACD for XRP/USD is about to move back in the bearish zone.
4-hours RSI (Relative Strength Index) – The RSI for XRP/USD is currently correcting lower towards the 50 level.
Major Support Level – $0.3000
Major Resistance Level – $0.3200


