
Reason to trust
How Our News is Made
Strict editorial policy that focuses on accuracy, relevance, and impartiality
Ad discliamer
Morbi pretium leo et nisl aliquam mollis. Quisque arcu lorem, ultricies quis pellentesque nec, ullamcorper eu odio.
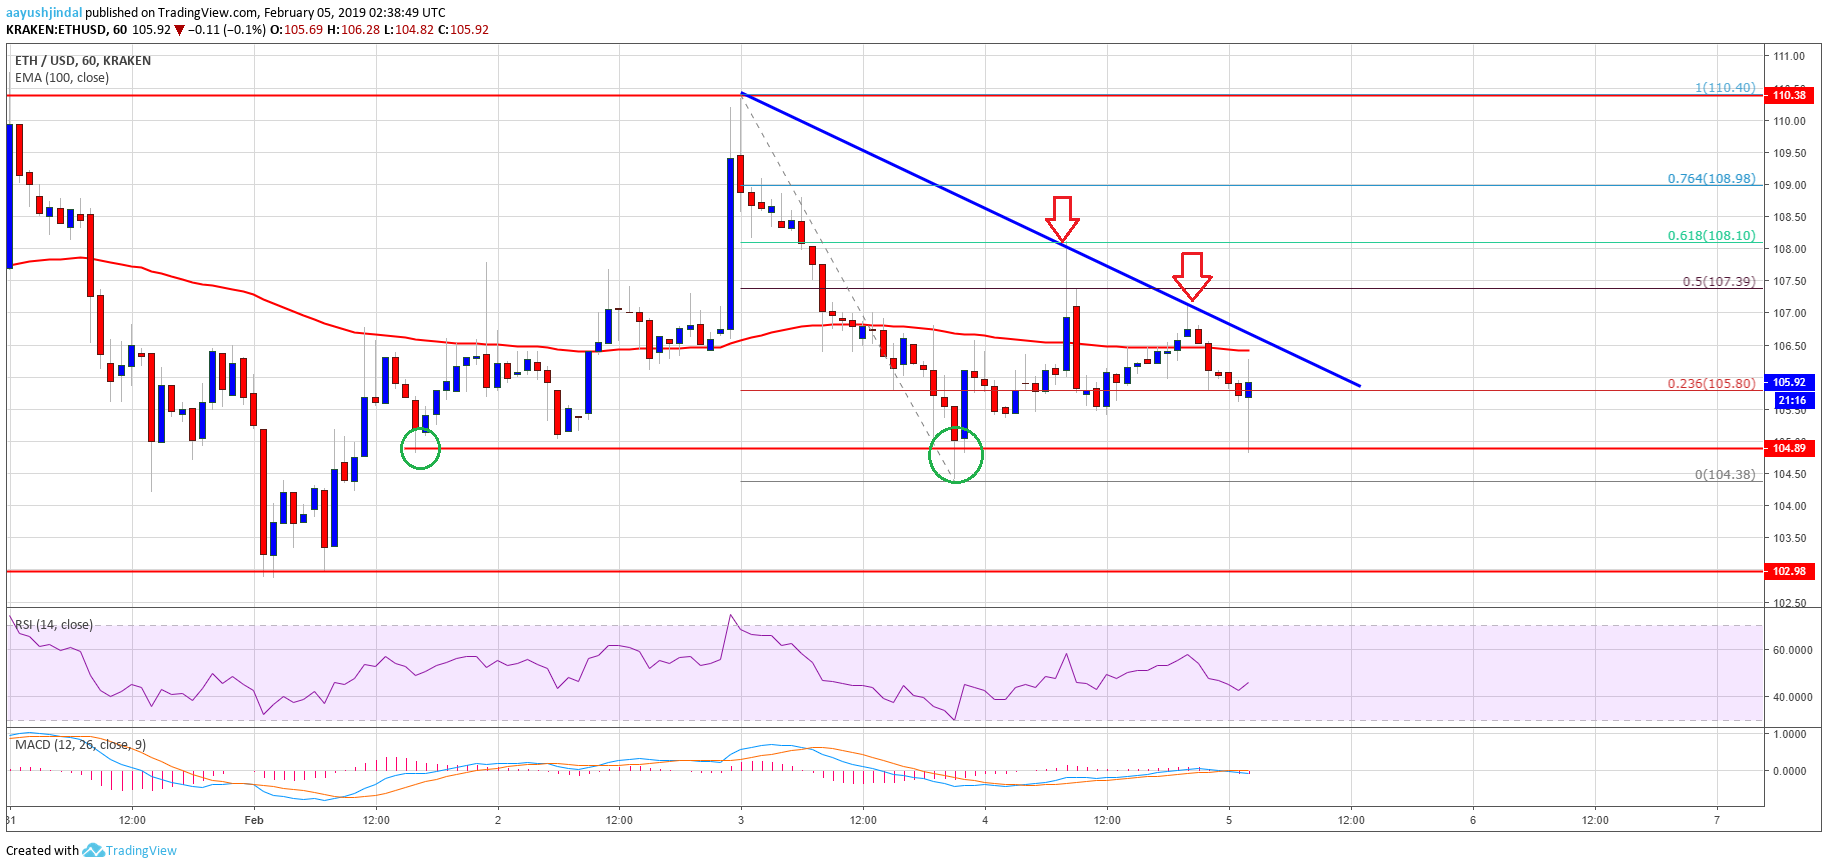
- ETH price is still trading below the $108 and $110 resistance levels against the US Dollar.
- There is a new connecting bearish trend line formed with resistance near $107 on the hourly chart of ETH/USD (data feed via Kraken).
- The pair remains supported on the downside above the $105 and $103 levels in the near term.
Ethereum price is confined in a tiny range against the US Dollar and bitcoin. ETH/USD could continue to consolidate until trading volumes pick up and price action improves.
Ethereum Price Analysis
There was a downside move from the $110 swing high in ETH price against the US Dollar. The ETH/USD pair traded below the $108 and $106 support levels, plus settled below the 100 hourly simple moving average. It tested the $105 support level, where buyers emerged and protected further losses. Later, there was an upside correction above the $106 and $107 levels. The price even broke the 50% Fib retracement level of the recent decline from the $110 high to $105 swing low. However, the upside move was capped by the $108 resistance area.
Moreover, the price was rejected near the 61.8% Fib retracement level of the recent decline from the $110 high to $105 swing low. There is also a new connecting bearish trend line formed with resistance near $107 on the hourly chart of ETH/USD. The pair is currently trading well below the $108 resistance and the 100 hourly simple moving average. A successful break above the trend line, 100 hourly simple moving average, and the $108 resistance is needed for more gains. The next major resistance is near the $110 level, above which the price could rally towards $115.
Looking at the chart, ETH price is clearly trading in a range below the $108 and $110 resistance levels. On the downside, an initial support is at $105, below which the price may test the $103 support level.
ETH Technical Indicators
Hourly MACD – The MACD for ETH/USD is slowly moving back in the bearish zone.
Hourly RSI – The RSI for ETH/USD is now well below the 50 level, with a few bearish signs.
Major Support Level – $103
Major Resistance Level – $108


