
Reason to trust
How Our News is Made
Strict editorial policy that focuses on accuracy, relevance, and impartiality
Ad discliamer
Morbi pretium leo et nisl aliquam mollis. Quisque arcu lorem, ultricies quis pellentesque nec, ullamcorper eu odio.
- Ripple price declined recently and broke the $0.3100 and $0.3070 supports against the US dollar.
- There is a major bearish trend line in place with resistance at $0.3030 on the hourly chart of the XRP/USD pair (data source from Kraken).
- The pair remains at a risk of more losses below the $0.3000 support area in the near term.
Ripple price tumbled and broke key supports against the US Dollar and Bitcoin. XRP/USD could accelerate losses towards the $0.2920 support in the coming sessions.
Ripple Price Analysis
This past week, there were mostly range moves, with a bearish formation below $0.3200 in ripple price against the US Dollar. The XRP/USD pair recently faced an increased selling pressure, resulting in more losses below $0.3100. The pair broke the $0.3070 support and the 100 hourly simple moving average. Sellers gained paced and pushed the price below the $0.3050 and $0.3020 supports as well. A new low was formed near $0.3000 and the price remains at a risk of more losses.
At the moment, the price is gaining bearish momentum below $0.3020. An initial resistance is at the 23.6% Fib retracement level of the recent slide from the $0.3075 high to $0.2997 low. Moreover, there is a major bearish trend line in place with resistance at $0.3030 on the hourly chart of the XRP/USD pair. It seems like the trend line and $0.3032 level may act as a solid barrier. Above these, the 50% Fib retracement level of the recent slide from the $0.3075 high to $0.2997 low is near $0.3036. Therefore, it seems like the $0.3030-0.3040 area might act as a solid barrier for buyers in the coming sessions.
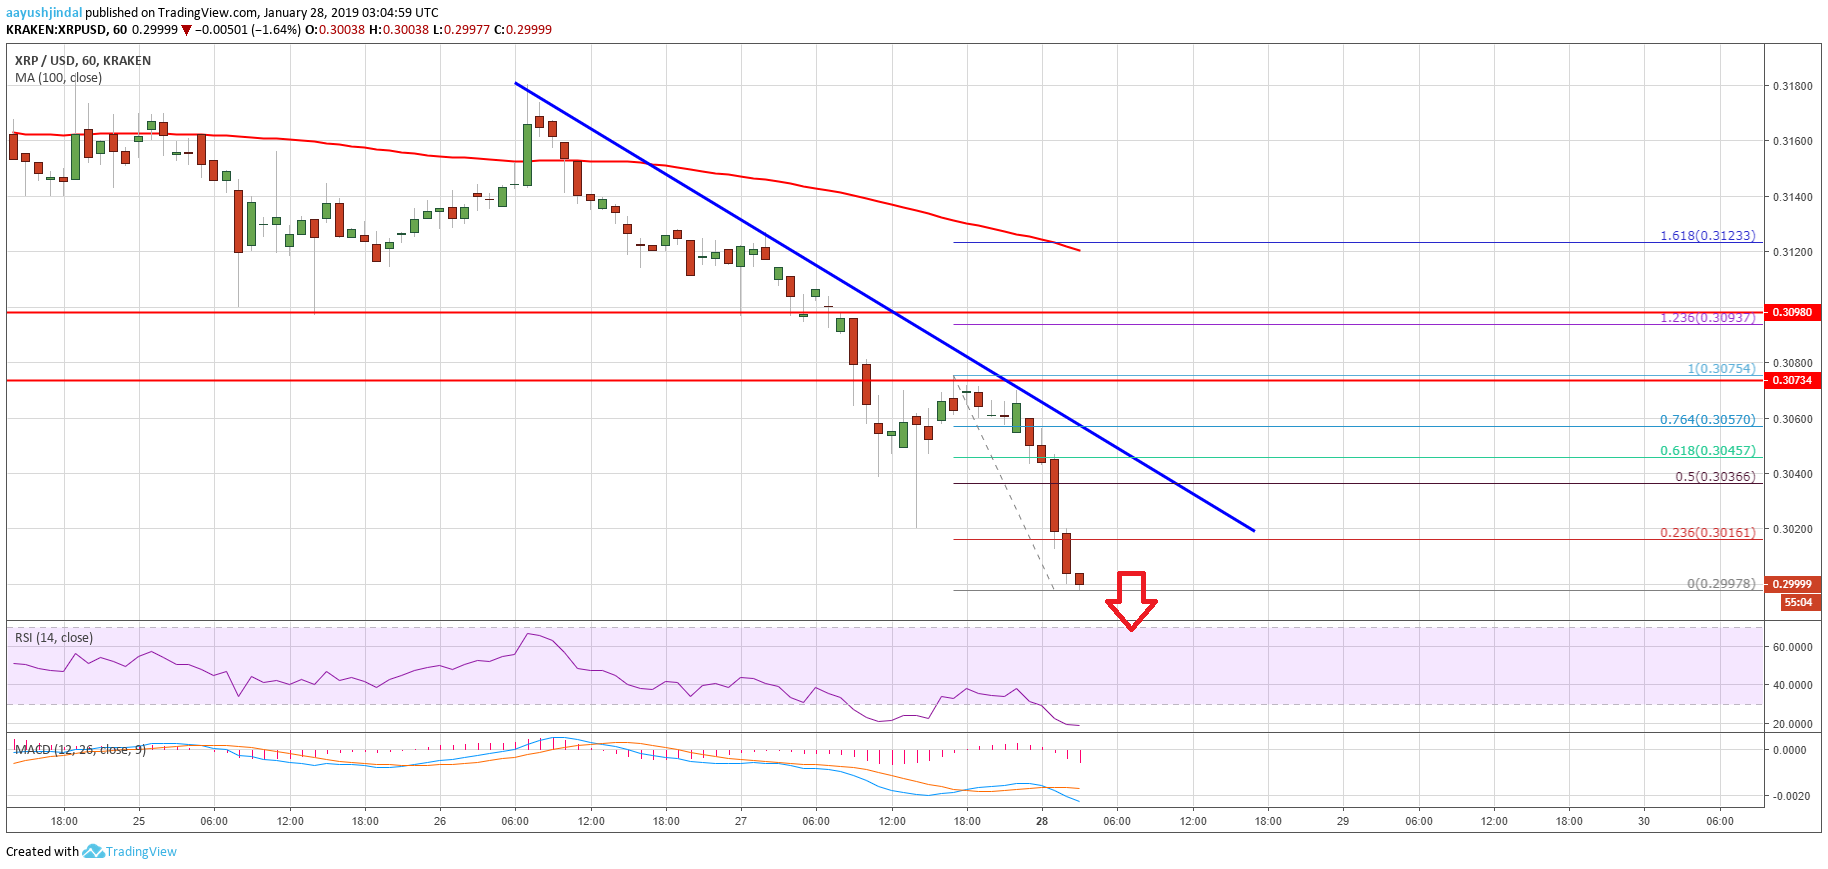
Looking at the chart, ripple price is clearly under pressure below $0.3040. Therefore, there are high chances of more declines below $0.3000. The next major support is near the $0.2920 level, where buyers are likely to appear.
Technical Indicators
Hourly MACD – The MACD for XRP/USD is gaining bearish momentum, with a lot of negative signs.
Hourly RSI (Relative Strength Index) – The RSI for XRP/USD is currently in the oversold area, with a bearish angle.
Major Support Level – $0.3000
Major Resistance Level – $0.3040


