
Reason to trust
How Our News is Made
Strict editorial policy that focuses on accuracy, relevance, and impartiality
Ad discliamer
Morbi pretium leo et nisl aliquam mollis. Quisque arcu lorem, ultricies quis pellentesque nec, ullamcorper eu odio.
- ETH price tested the $119-120 resistance area and failed to gain strength against the US Dollar.
- There is a short term declining channel formed with resistance near $118 on the hourly chart of ETH/USD (data feed via Kraken).
- The pair is currently at a risk of more losses as long as it is trading below the $118 and $120 hurdles.
Ethereum price failed to stay in the positive zone against the US Dollar and bitcoin. ETH/USD trimmed most its gains and it is likely heading towards the $114 support level.
Ethereum Price Analysis
Yesterday, we saw a nice upward move above the $114 and $115 resistances in ETH price against the US Dollar. The ETH/USD pair even spiked above the $118 resistance and the 100 hourly simple moving average. However, it failed to break the $120 resistance area. There was also no close above the 61.8% Fib retracement level of the last downside move from the $125 high to $111 swing low. The price started a fresh decline and traded below the $118 level and the 100 hourly SMA.
Moreover, there was a break below the 50% Fib retracement level of the recent wave from the $111 low to $120 swing high. At the outset, there is a short term declining channel formed with resistance near $118 on the hourly chart of ETH/USD. The channel support is at $114, where buyers are likely to emerge. Above $114, the 61.8% Fib retracement level of the recent wave from the $111 low to $120 swing high is a decent support. Below $114, the price could dip towards the $112 and $111 levels.
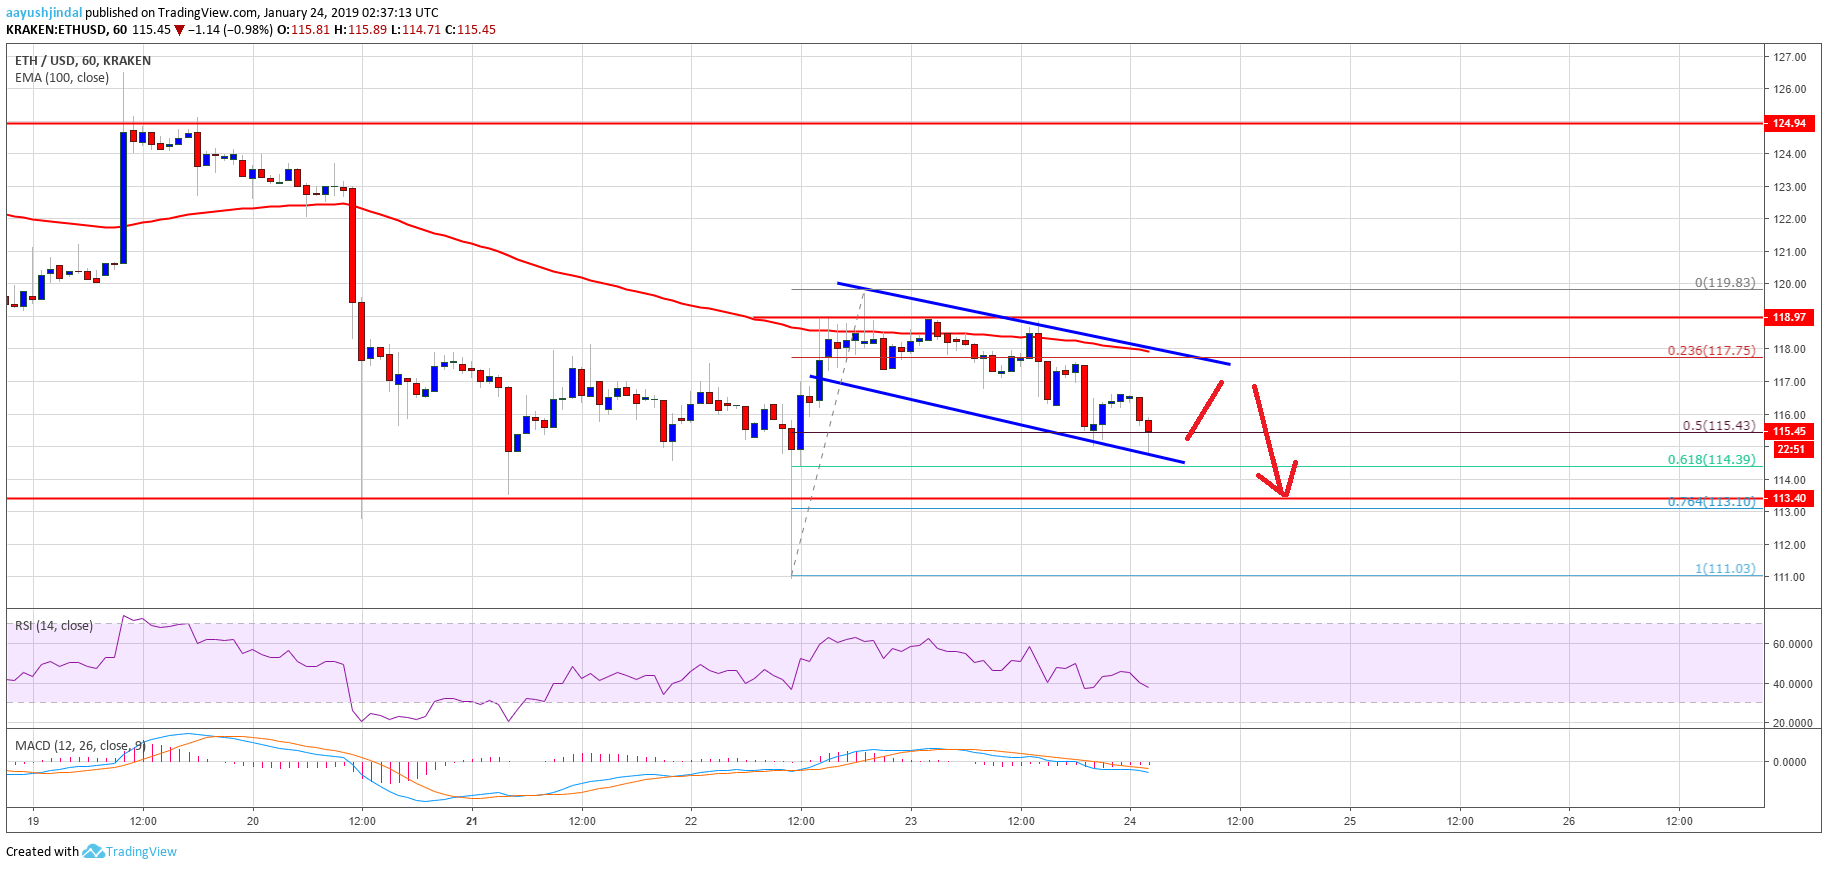
Looking at the chart, ETH price is facing a major resistance near the channel, $118, and the 100 hourly simple moving average. A successful break and close above $120 is needed for more gains towards $124 and $127. If buyers fail, the price may continue to move down towards $112.
ETH Technical Indicators
Hourly MACD – The MACD for ETH/USD is currently placed in the bearish zone, with negative signs.
Hourly RSI – The RSI for ETH/USD is moving lower towards the 35 and 30 levels.
Major Support Level – $114
Major Resistance Level – $118


