
Reason to trust
How Our News is Made
Strict editorial policy that focuses on accuracy, relevance, and impartiality
Ad discliamer
Morbi pretium leo et nisl aliquam mollis. Quisque arcu lorem, ultricies quis pellentesque nec, ullamcorper eu odio.
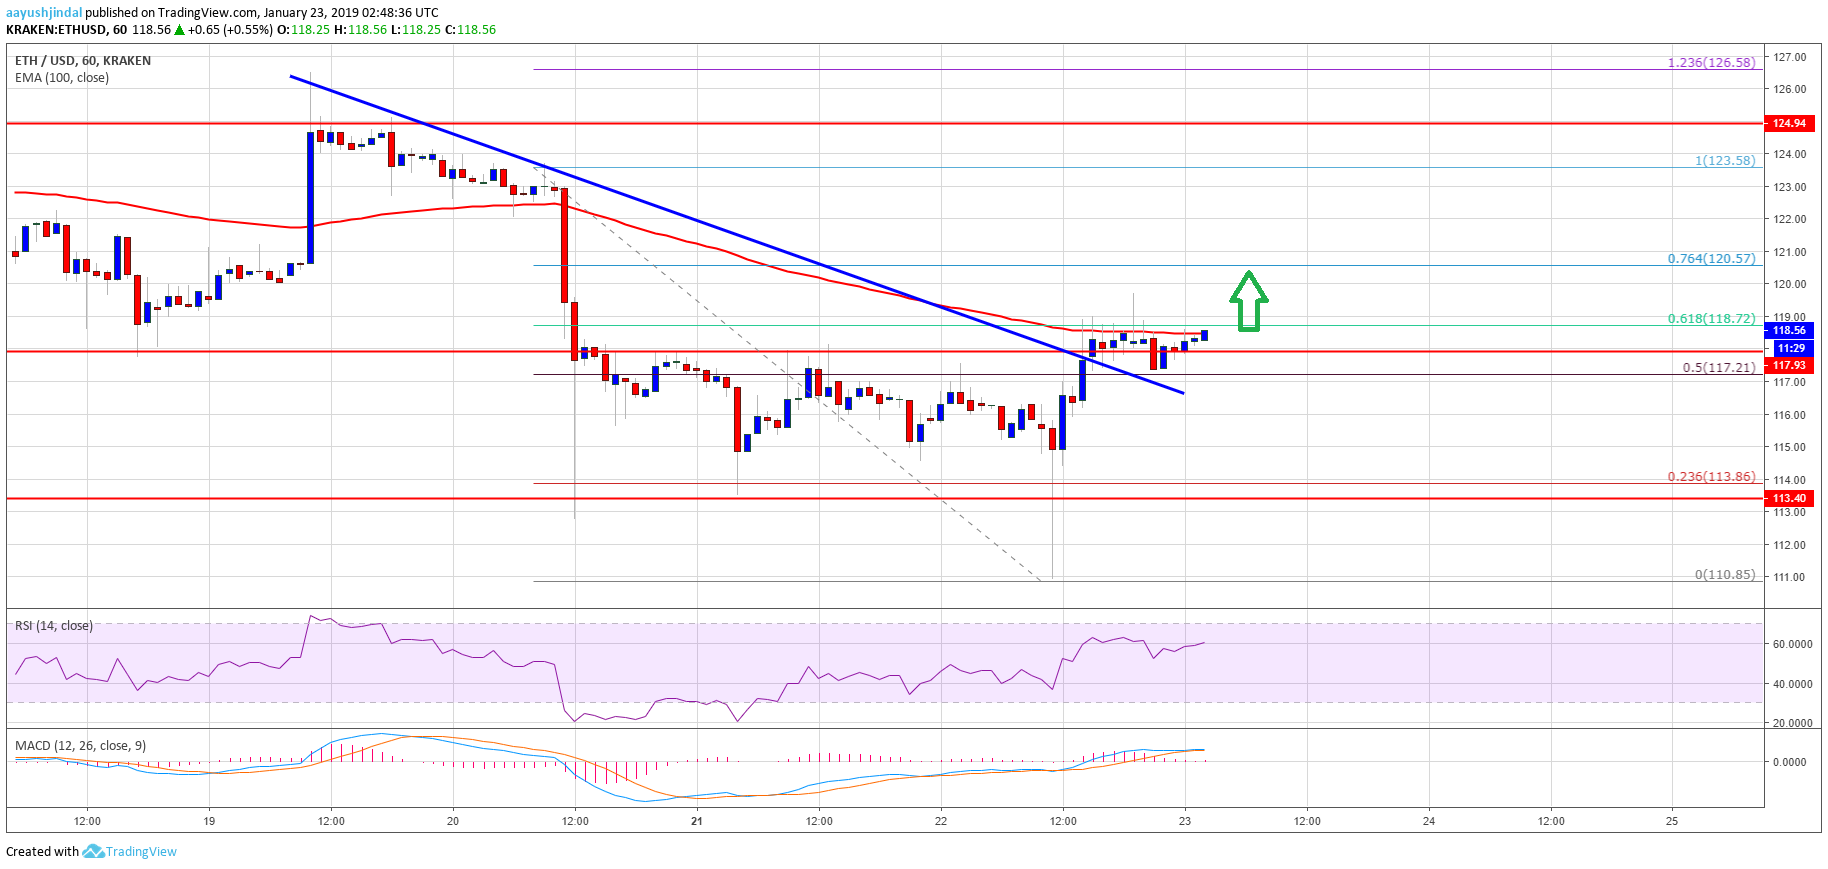
- ETH price tested the $110-111 support area and later bounced back above $116 against the US Dollar.
- This week’s followed key bearish trend line was breached with resistance at $118 on the hourly chart of ETH/USD (data feed via Kraken).
- The pair is now placed above the $116 resistance and it could continue to move higher towards $125.
Ethereum price started a decent upside recovery against the US Dollar and bitcoin. ETH/USD could gain momentum once there is a break above the $121-122 resistance zone.
Ethereum Price Analysis
Recently, there was a downside extension below the $114 support area in ETH price against the US Dollar. The ETH/USD pair dipped below the $112 level and tested the $110-111 support area. However, buyers protected the $110-111 support area and later the price bounced back sharply. It traded above the $112, $114 and $116 resistance levels. There was also a break above the 50% Fib retracement level of the recent decline from the $124 high to $111 swing low.
More importantly, this week’s followed key bearish trend line was breached with resistance at $118 on the hourly chart of ETH/USD. The pair spiked above the $118 level and it is currently consolidating gains. Besides, the 100 hourly simple moving average is acting as a resistance near the $119-120 zone. The 61.8% Fib retracement level of the recent decline from the $124 high to $111 swing low is also near $119. Therefore, a proper break above the $119, $120 and $122 resistance levels could push the price further higher. The next important resistance is at $125, where sellers may emerge.
Looking at the chart, ETH price clearly bounced back nicely from the $110-111 support area. However, it must surpass the $119, $120 and $122 resistance levels to remain in a positive zone. If not, the price is likely to trim recent gains and trade back towards the $114 support level.
ETH Technical Indicators
Hourly MACD – The MACD for ETH/USD is slowly moving back in the bearish zone, with no major negative signs.
Hourly RSI – The RSI for ETH/USD is currently placed well above the 50 and 55 levels.
Major Support Level – $114
Major Resistance Level – $120


