
Reason to trust
How Our News is Made
Strict editorial policy that focuses on accuracy, relevance, and impartiality
Ad discliamer
Morbi pretium leo et nisl aliquam mollis. Quisque arcu lorem, ultricies quis pellentesque nec, ullamcorper eu odio.
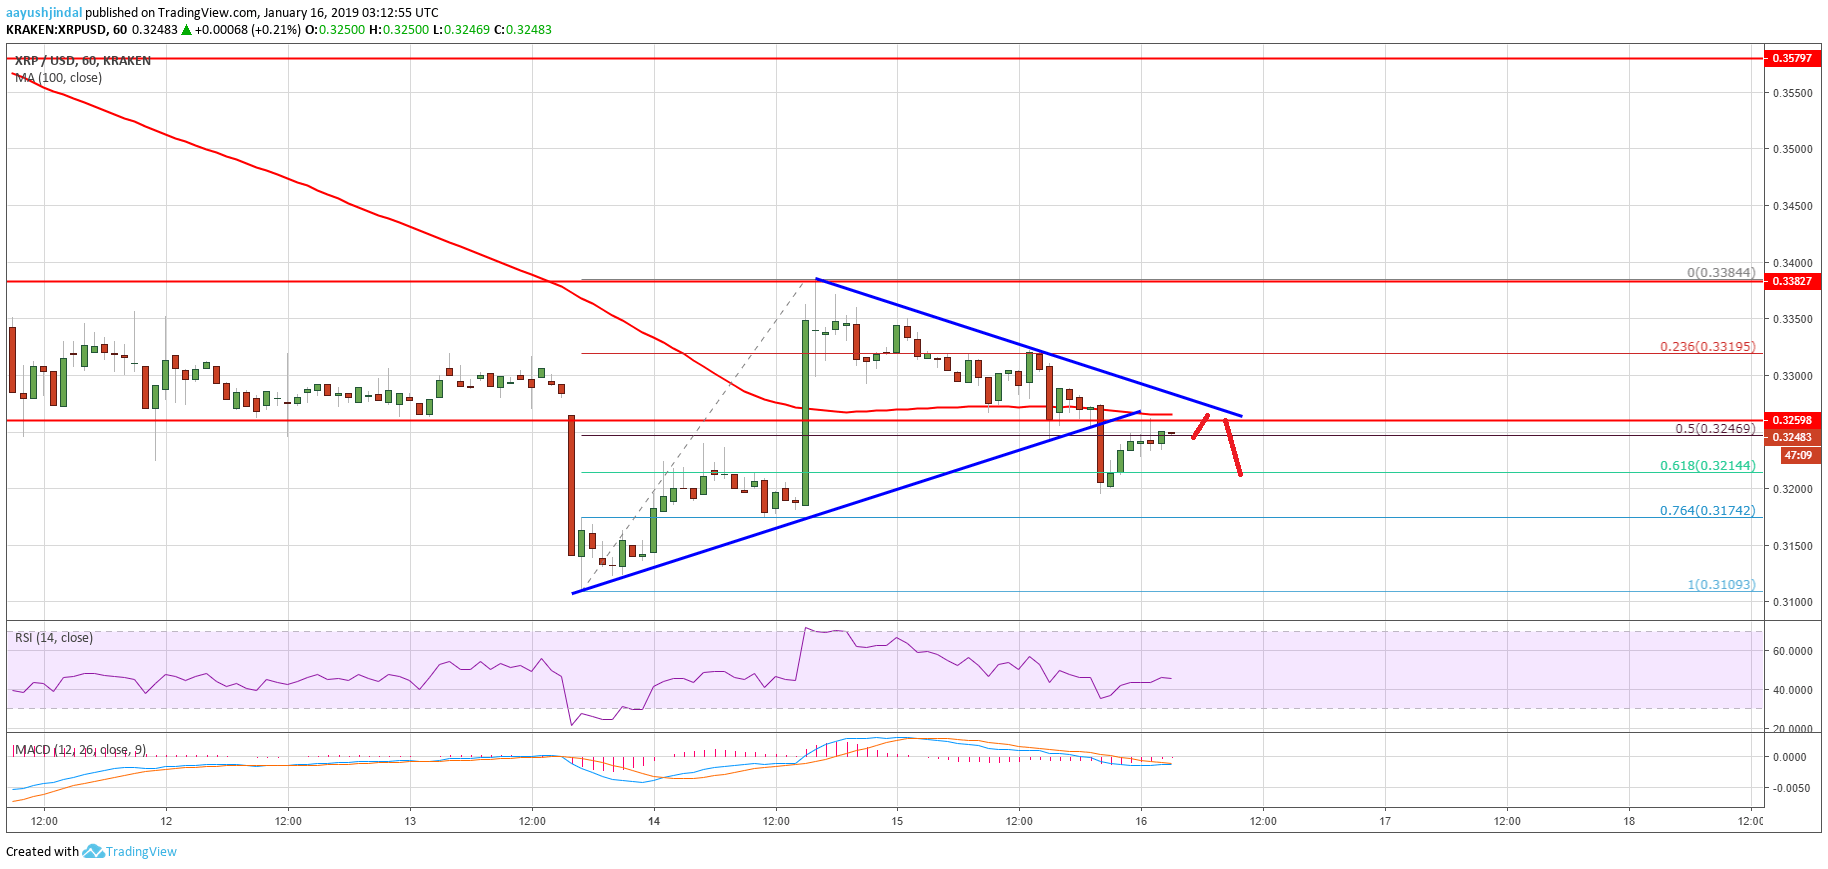
- Ripple price traded to a new weekly high at $0.3384 and later corrected lower against the US dollar.
- There was a break below a key bullish trend line with support at $0.3250 on the hourly chart of the XRP/USD pair (data source from Kraken).
- The pair must trade above $0.3260 and the 100 hourly simple moving average to gain traction.
Ripple price is showing a few bearish signs against the US Dollar and Bitcoin. XRP/USD must stay above $0.3170 to bounce back above $0.3260 and $0.3300 in the near term.
Ripple Price Analysis
Yesterday, we saw a decent upside recovery above the $0.3250 resistance in ripple price against the US Dollar. The XRP/USD pair even traded above the $0.3300 resistance area. A new weekly high was formed at $0.3384 and later the price corrected lower. It declined below the $0.3300 support and the 100 hourly simple moving average. Sellers also pushed the price below the 50% Fib retracement level of the recent wave from the $0.3109 low to $0.3384 high.
During the decline, there was a break below a key bullish trend line with support at $0.3250 on the hourly chart of the XRP/USD pair. The pair is now trading well below $0.3260 and the 61.8% Fib retracement level of the recent wave from the $0.3109 low to $0.3384 high. It tested the $0.3200 support and corrected a few points recently. However, there is a strong resistance formed near $0.3250, $0.3260, and the 100 hourly SMA. Moreover, the broken trend line may also stop gains near $0.3270. Finally, there is a short term connecting bearish trend line with resistance at $0.3265 on the same chart.
Looking at the chart, ripple price seems to be trading near a key turning point above $0.3200. It could either break the $0.3260 and $0.3270 resistance levels or decline below $0.3200. On the upside, a break above $0.3270 may push the price towards $0.3350 and $0.3380.
Technical Indicators
Hourly MACD – The MACD for XRP/USD may make an attempt to move in the bullish zone.
Hourly RSI (Relative Strength Index) – The RSI for XRP/USD is currently just around the 50 level.
Major Support Level – $0.3200
Major Resistance Level – $0.3270


