
Reason to trust
How Our News is Made
Strict editorial policy that focuses on accuracy, relevance, and impartiality
Ad discliamer
Morbi pretium leo et nisl aliquam mollis. Quisque arcu lorem, ultricies quis pellentesque nec, ullamcorper eu odio.
- Bitcoin price declined below the $3,550 support and tested the $3,380 level against the US Dollar.
- There was a break below a major bullish trend line with support at $3,590 on the hourly chart of the BTC/USD pair (data feed from Kraken).
- The price is currently recovering, but it could face strong resistances near $3,550. $3,580 and $3,640.
Bitcoin price extended losses below the $3,600 support against the US Dollar. BTC may recover in the short term, but upsides are likely to be capped by $3,600-3,650.
Bitcoin Price Analysis
In the weekly analysis, we saw a consolidation pattern above the $3,550 support in bitcoin price against the US Dollar. The BTC/USD pair traded in a range for some time, but later sellers managed to push the price below $3,550. The price declined heavily and broke the $3,500 and $3,400 support levels. There was even a close below the $3,500 level and the 100 hourly simple moving average. A new monthly low was formed at $3,372 and later the price started an upside correction.
It moved above the $3,500 level to move into a short term positive zone. There was a break above the 50% Fib retracement level of the last dive from the $3,649 high to $3,372 low. On the upside, there are many barriers for buyers, starting with $3,550. The previous support near $3,550 and $3,560 may perhaps act as a strong resistance. Above $3,560, the 76.4% Fib retracement level of the last dive from the $3,649 high to $3,372 low is at $3,585. Finally, there is a connecting bearish trend line in place with resistance at $3,600 on the hourly chart.
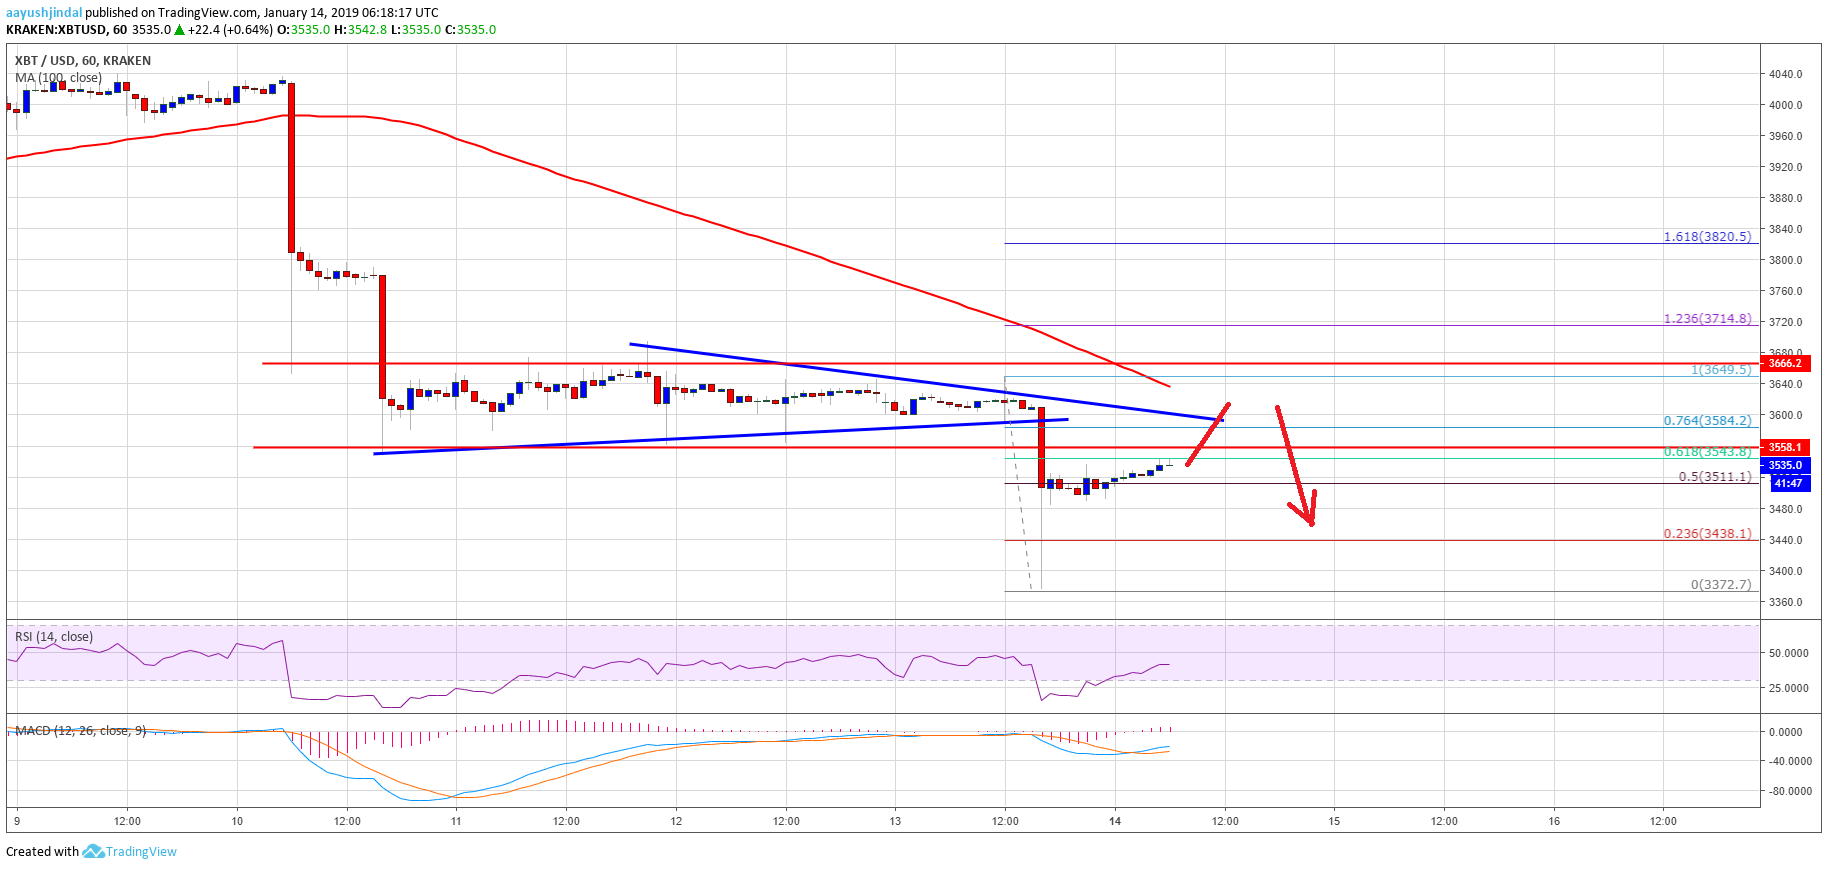
Looking at the chart, bitcoin price is likely to face a lot of sellers near the $3,550, $3,560, $3,585 and $3,600 levels. The main resistance is at $3,640, above which there is a chance of a solid recovery to $3,800. On the downside, a break below $3,375 could lead the price to $3,220.
Technical indicators
Hourly MACD – The MACD for BTC/USD moved back in the bullish zone.
Hourly RSI (Relative Strength Index) – The RSI for BTC/USD is moving higher towards the 50 level, with a positive angle.
Major Support Level – $3,400
Major Resistance Level – $3,640


