
Reason to trust
How Our News is Made
Strict editorial policy that focuses on accuracy, relevance, and impartiality
Ad discliamer
Morbi pretium leo et nisl aliquam mollis. Quisque arcu lorem, ultricies quis pellentesque nec, ullamcorper eu odio.
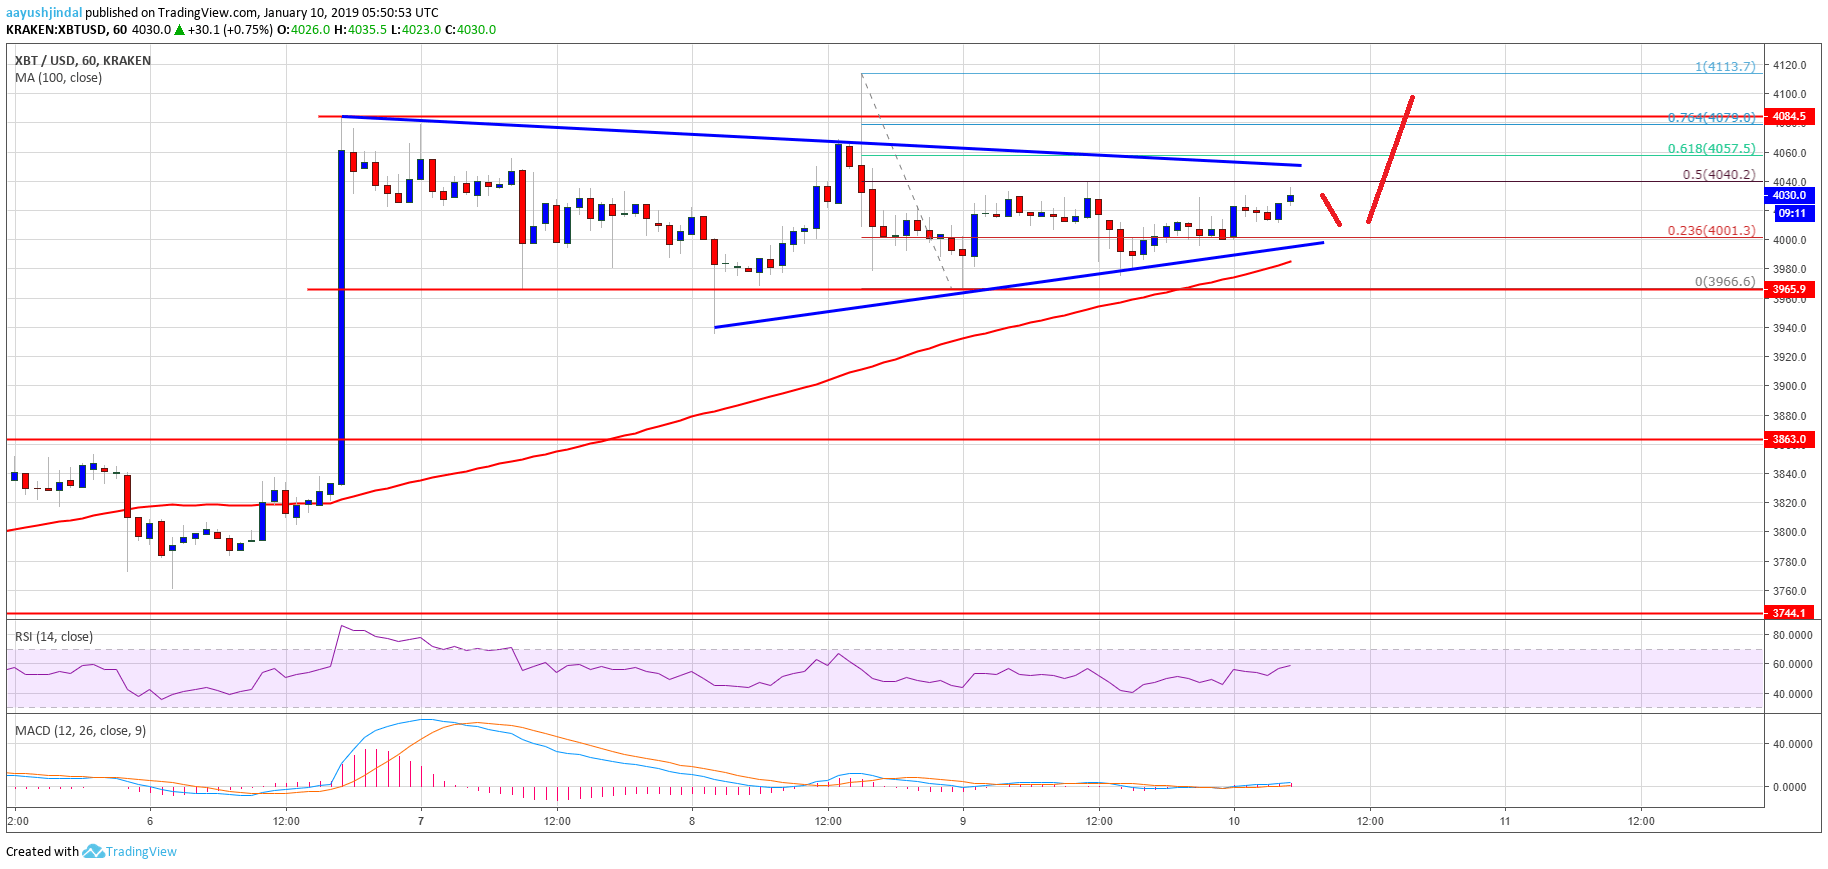
- Bitcoin price is placed nicely above the $3,965 and $3,980 support levels against the US Dollar.
- There is a short term triangle forming with resistance at $4,045 on the hourly chart of the BTC/USD pair (data feed from Kraken).
- The price may continue to move higher towards $4,250 if there is a clear break above $4,080.
Bitcoin price is gaining bullish momentum above $4,000 against the US Dollar. BTC remains supported on dips and it may soon climb above the $4,150 and $4,200 resistances.
Bitcoin Price Analysis
Yesterday, we discussed the key support at $3,940 for bitcoin price against the US Dollar. The BTC/USD pair stayed above the mentioned support and it slowly moved above $3,965 and $3,980. Buyers pushed the price above the $4,000 level. There was a break above the 23.6% Fib retracement level of the last drop from the $4,114 swing high to $3,965 swing low. It opened the doors for more gains above $4,050 and the price is now well above the 100 hourly simple moving average.
An initial resistance is near the $4,040 level. It represents the 50% Fib retracement level of the last drop from the $4,114 swing high to $3,965 swing low. More importantly, there is a short term triangle forming with resistance at $4,045 on the hourly chart of the BTC/USD pair. Therefore, a break above the triangle and $4,050 may open the doors for more gains in the near term. The next resistance is at $4,085, above which the price may climb towards the $4,150 and $4,200 levels. An intermediate resistance is the 1.236 Fib extension level of the last drop near $4,140.
Looking at the chart, bitcoin price is trading with a bullish tone above the $3,965 support. If there is a downside reaction below $3,965, the price may decline towards the $3,940 and $3,920 support levels. The main support below $3,920 is at $3,860.
Technical indicators
Hourly MACD – The MACD for BTC/USD is slowly gaining pace in the bullish zone, with a positive bias.
Hourly RSI (Relative Strength Index) – The RSI for BTC/USD is now above the 55 level, with a bullish angle.
Major Support Level – $3,965
Major Resistance Level – $4,085


