
Reason to trust
How Our News is Made
Strict editorial policy that focuses on accuracy, relevance, and impartiality
Ad discliamer
Morbi pretium leo et nisl aliquam mollis. Quisque arcu lorem, ultricies quis pellentesque nec, ullamcorper eu odio.
- Bitcoin price remained well bid near the $3,980 and $3,940 supports against the US Dollar.
- Yesterday’s highlighted key bullish trend line is intact with support at $3,990 on the hourly chart of the BTC/USD pair (data feed from Kraken).
- The price may dip a few points towards $3,950 before making another attempt to clear $4,100.
Bitcoin price traded to a new weekly high above $4,100 against the US Dollar. BTC is correcting lower, but dips remain supported above $3,940 in the near term.
Bitcoin Price Analysis
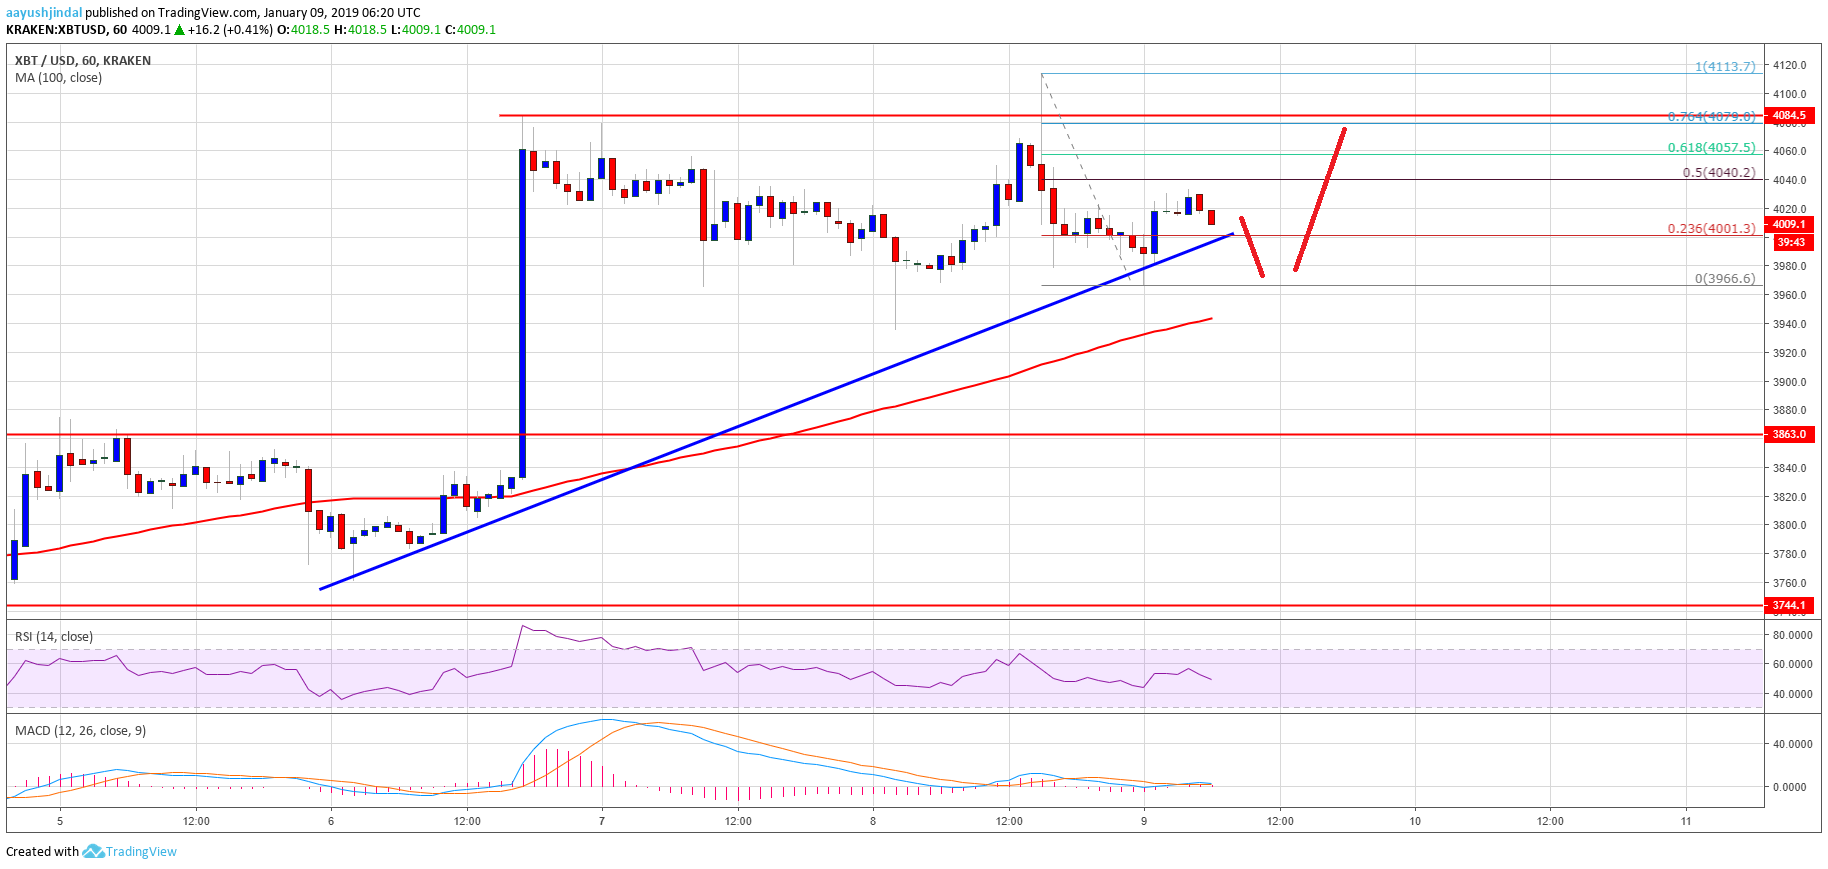
Yesterday, we discussed about a couple of important supports near $3,940 for bitcoin price against the US Dollar. The BTC/USD pair did correct lower recently, but it found support near $3,940. Later, the price recovered nicely above $4,000 and the $4,050 levels. Buyers even breached the last swing high at $4,084 and a new weekly high was formed at $4,113. However, buyers failed to retain strength, resulting in a drop below $4,080.
The price even broke the $4,000 support and traded close to the $3,950 level. A swing low was formed at $3,966 and the price stayed above the 100 hourly simple moving average. More importantly, yesterday’s highlighted key bullish trend line is intact with support at $3,990 on the hourly chart of the BTC/USD pair. The pair is now trading above the 23.6% Fib retracement level of the recent decline from the $4,113 high to $3,966 low. The current price action is slightly bearish below $4,050. Therefore, there is a risk of a dip towards the $3,950 support to fill buy orders. On the upside, a break above the $4,040 and $4,050 is needed for more gains. Besides, the 50% Fib retracement level of the recent decline from the $4,113 high to $3,966 low is at $4,040.
Looking at the chart, bitcoin price is well supported above the $3,940. Having said that, a break above the $4,040 and $4,080 levels is needed for more gains.
Technical indicators
Hourly MACD – The MACD for BTC/USD is about to move back in the bearish zone, with a negative bias.
Hourly RSI (Relative Strength Index) – The RSI for BTC/USD just dipped below the 50 level, with a bearish angle.
Major Support Level – $3,940
Major Resistance Level – $4,080


