
Reason to trust
How Our News is Made
Strict editorial policy that focuses on accuracy, relevance, and impartiality
Ad discliamer
Morbi pretium leo et nisl aliquam mollis. Quisque arcu lorem, ultricies quis pellentesque nec, ullamcorper eu odio.
Key Highlights
- ETH price surged higher and broke a key resistance near $210 against the US Dollar.
- This week’s followed important bearish trend line was breached near $209 on the hourly chart of ETH/USD (data feed via Kraken).
- The pair traded towards the $230 level and it is currently correcting lower in the near term.
Ethereum price is positioned for more gains against the US Dollar and bitcoin. ETH/USD could correct lower, but dips towards $416 and $412 remains supported.
Ethereum Price Analysis
Recently, there was a consolidation phase formed below the $212 and $216 resistances for ETH price against the US Dollar. The ETH/USD pair formed a decent support base near the $207 level and later started an upside move. It broke many resistances during the rise such as $210, $212 and $216. The price also settled above the $210 level and the 100 hourly simple moving average.
More importantly, this week’s followed important bearish trend line was breached near $209 on the hourly chart of ETH/USD. The pair even broke the $220 resistance and traded towards the $230 level. A new intraday high was formed at $229.88 before the price started a downside correction. At present, the price is treading near the $220 level. It is close to the 23.6% Fib retracement level of the last wave from the $197 low to $229 high. If there is a downside extension, the price could test the previous resistance near $216. It is above the 50% Fib retracement level of the last wave from the $197 low to $229 high.
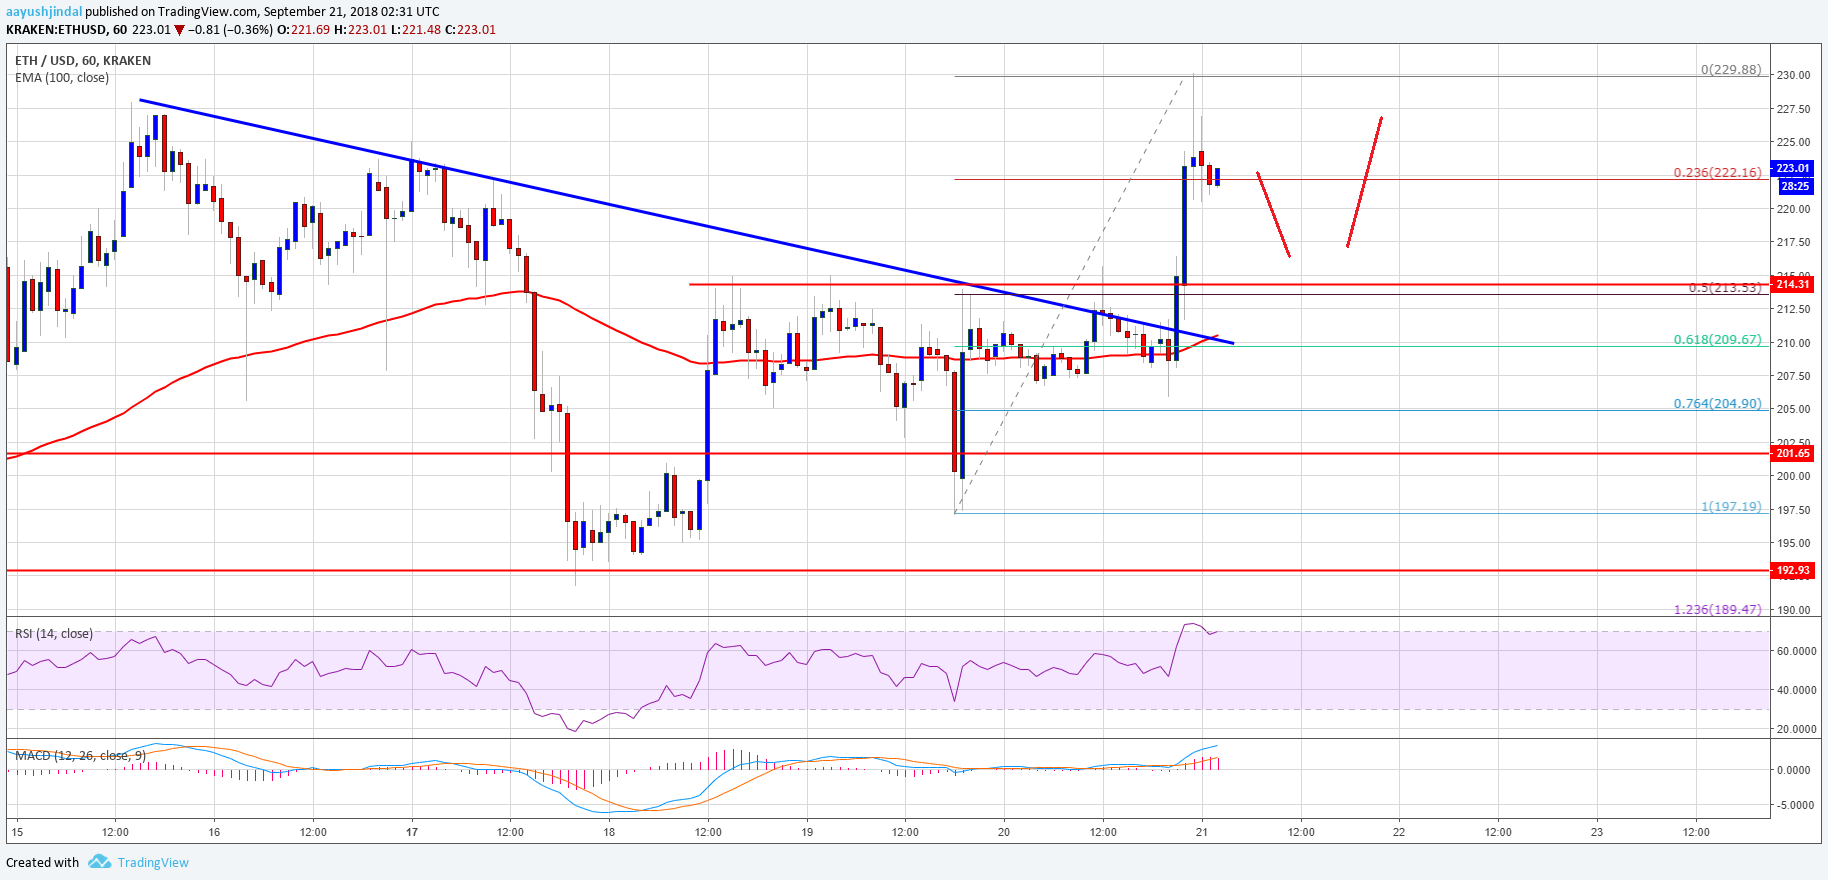
Looking at the chart, ETH price trading with a bullish bias above the $216 level. Any correction from the current levels is likely to find support near $216 and $213. On the upside, a break above the $228 and $230 resistance could push the price towards $240.
Hourly MACD – The MACD is gaining strength in the bullish zone.
Hourly RSI – The RSI is well above the 60 level.
Major Support Level – $216
Major Resistance Level – $228


